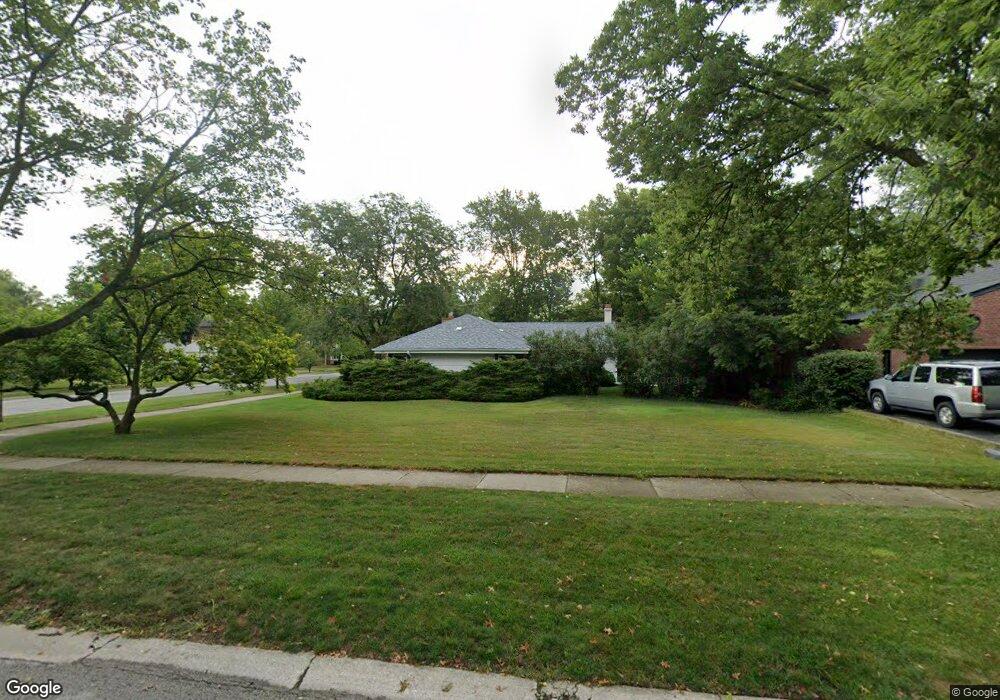
605 Argyle Ave Flossmoor, IL 60422
Estimated Value: $263,199 - $313,000
3
Beds
2
Baths
1,369
Sq Ft
$212/Sq Ft
Est. Value
About This Home
This home is located at 605 Argyle Ave, Flossmoor, IL 60422 and is currently estimated at $290,300, approximately $212 per square foot. 605 Argyle Ave is a home located in Cook County with nearby schools including Western Avenue Elementary School, Parker Junior High School, and Homewood-Flossmoor High School.
Ownership History
Date
Name
Owned For
Owner Type
Purchase Details
Closed on
Aug 8, 2016
Sold by
So Frank S
Bought by
So Frank S and Huggett Deborah L
Current Estimated Value
Purchase Details
Closed on
Jan 17, 2002
Sold by
So Frank S
Bought by
Frank S So Declaration Of Trust
Create a Home Valuation Report for This Property
The Home Valuation Report is an in-depth analysis detailing your home's value as well as a comparison with similar homes in the area
Home Values in the Area
Average Home Value in this Area
Purchase History
| Date | Buyer | Sale Price | Title Company |
|---|---|---|---|
| So Frank S | -- | None Available | |
| Frank S So Declaration Of Trust | -- | -- |
Source: Public Records
Tax History
| Year | Tax Paid | Tax Assessment Tax Assessment Total Assessment is a certain percentage of the fair market value that is determined by local assessors to be the total taxable value of land and additions on the property. | Land | Improvement |
|---|---|---|---|---|
| 2025 | $6,824 | $22,000 | $7,357 | $14,643 |
| 2024 | $6,824 | $22,000 | $7,357 | $14,643 |
| 2023 | $4,935 | $22,000 | $7,357 | $14,643 |
| 2022 | $4,935 | $15,333 | $6,354 | $8,979 |
| 2021 | $5,031 | $15,331 | $6,353 | $8,978 |
| 2020 | $5,031 | $15,331 | $6,353 | $8,978 |
| 2019 | $4,440 | $14,411 | $5,684 | $8,727 |
| 2018 | $4,267 | $14,411 | $5,684 | $8,727 |
| 2017 | $4,244 | $14,411 | $5,684 | $8,727 |
| 2016 | $3,763 | $11,386 | $5,016 | $6,370 |
| 2015 | $3,666 | $11,386 | $5,016 | $6,370 |
| 2014 | $3,646 | $11,386 | $5,016 | $6,370 |
| 2013 | $4,453 | $13,827 | $5,016 | $8,811 |
Source: Public Records
Map
Nearby Homes
- 625 Perth Ave
- 625 Bruce Ave
- 2619 Alexander St
- 18511 Argyle Ave
- 18509 Stedhall Rd
- 18530 Stedhall Rd
- 18441 Stewart Ave
- 18450 Stedhall Rd
- 18404 Perth Ave
- 712 Gardner Rd
- 18400 Cherry Creek Dr Unit 105
- 2323 Clyde Terrace
- 2303 Hutchison Rd
- 2807 Willow Rd Unit 103
- 725 Braemar Rd
- 18537 Palmer Ave
- 2440 183rd St
- 18646 Palmer Cir
- 846 Park Dr
- 18310 Cherry Creek Dr Unit 2
- 611 Argyle Ave
- 18561 Argyle Ave
- 617 Argyle Ave
- 2516 Heather Rd
- 612 Perth Ave
- 18555 Argyle Ave
- 2520 Heather Rd
- 618 Perth Ave
- 604 Argyle Ave
- 623 Argyle Ave
- 612 Argyle Ave
- 18556 Stewart Ave
- 18551 Argyle Ave
- 18560 Argyle Ave
- 618 Argyle Ave
- 624 Perth Ave
- 18552 Stewart Ave
- 629 Argyle Ave
- 18552 Argyle Ave
- 18550 Stewart Ave
Your Personal Tour Guide
Ask me questions while you tour the home.