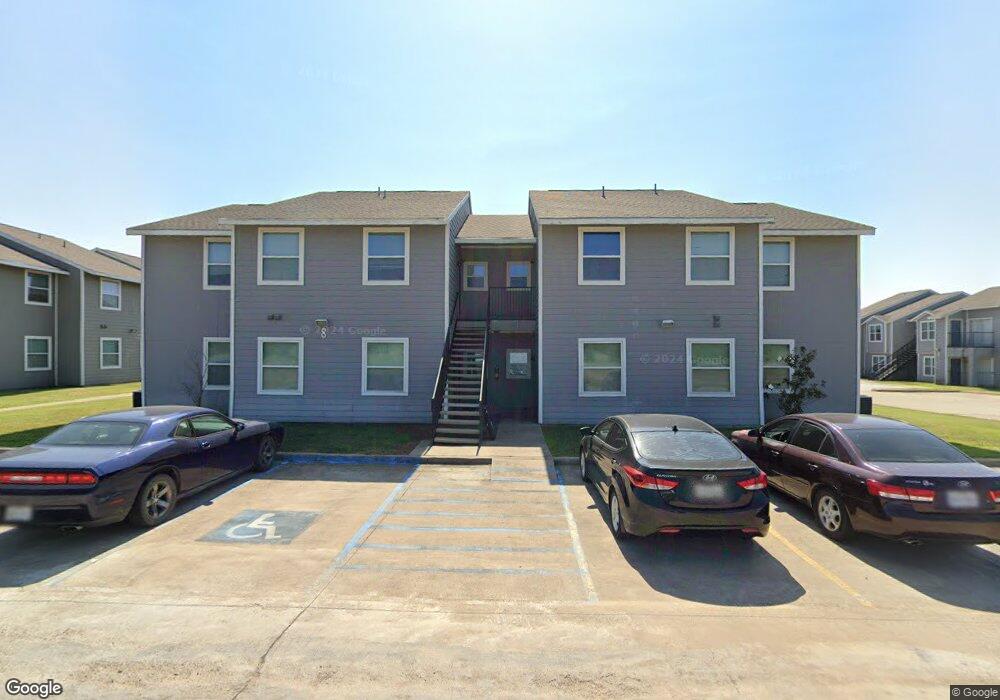
605 Beech St Bonham, TX 75418
Estimated Value: $124,493 - $158,000
Studio
--
Bath
1,216
Sq Ft
$121/Sq Ft
Est. Value
About This Home
This home is located at 605 Beech St, Bonham, TX 75418 and is currently estimated at $146,623, approximately $120 per square foot. 605 Beech St is a home located in Fannin County with nearby schools including Evans Elementary School, Finley-Oates Elementary School, and LH Rather Jr High School.
Ownership History
Date
Name
Owned For
Owner Type
Purchase Details
Closed on
Feb 28, 2023
Sold by
Country Village Investments Llc
Bought by
Varela Jose Luis Varela and Ordonez Martha Isabel
Current Estimated Value
Home Financials for this Owner
Home Financials are based on the most recent Mortgage that was taken out on this home.
Original Mortgage
$58,500
Outstanding Balance
$41,871
Interest Rate
6.15%
Mortgage Type
New Conventional
Estimated Equity
$104,752
Purchase Details
Closed on
Jul 16, 1976
Sold by
Carter Creta Lynn
Bought by
Country Village Investments Ll
Create a Home Valuation Report for This Property
The Home Valuation Report is an in-depth analysis detailing your home's value as well as a comparison with similar homes in the area
Purchase History
| Date | Buyer | Sale Price | Title Company |
|---|---|---|---|
| Varela Jose Luis Varela | -- | -- | |
| Country Village Investments Ll | -- | Cole Title |
Source: Public Records
Mortgage History
| Date | Status | Borrower | Loan Amount |
|---|---|---|---|
| Open | Varela Jose Luis Varela | $58,500 |
Source: Public Records
Tax History
| Year | Tax Paid | Tax Assessment Tax Assessment Total Assessment is a certain percentage of the fair market value that is determined by local assessors to be the total taxable value of land and additions on the property. | Land | Improvement |
|---|---|---|---|---|
| 2025 | $1,726 | $88,990 | $48,340 | $40,650 |
| 2024 | $1,706 | $87,980 | $46,060 | $41,920 |
| 2023 | $1,507 | $76,430 | $33,250 | $43,180 |
| 2022 | $1,188 | $54,000 | $24,710 | $29,290 |
| 2021 | $1,250 | $49,440 | $14,730 | $34,710 |
| 2020 | $1,146 | $44,830 | $11,210 | $33,620 |
| 2019 | $990 | $37,260 | $4,960 | $32,300 |
| 2018 | $857 | $32,310 | $4,960 | $27,350 |
| 2017 | $718 | $28,080 | $4,120 | $23,960 |
| 2016 | $729 | $28,530 | $7,320 | $21,210 |
| 2015 | -- | $18,550 | $6,660 | $11,890 |
| 2014 | -- | $19,190 | $6,660 | $12,530 |
Source: Public Records
Map
Nearby Homes
Your Personal Tour Guide
Ask me questions while you tour the home.