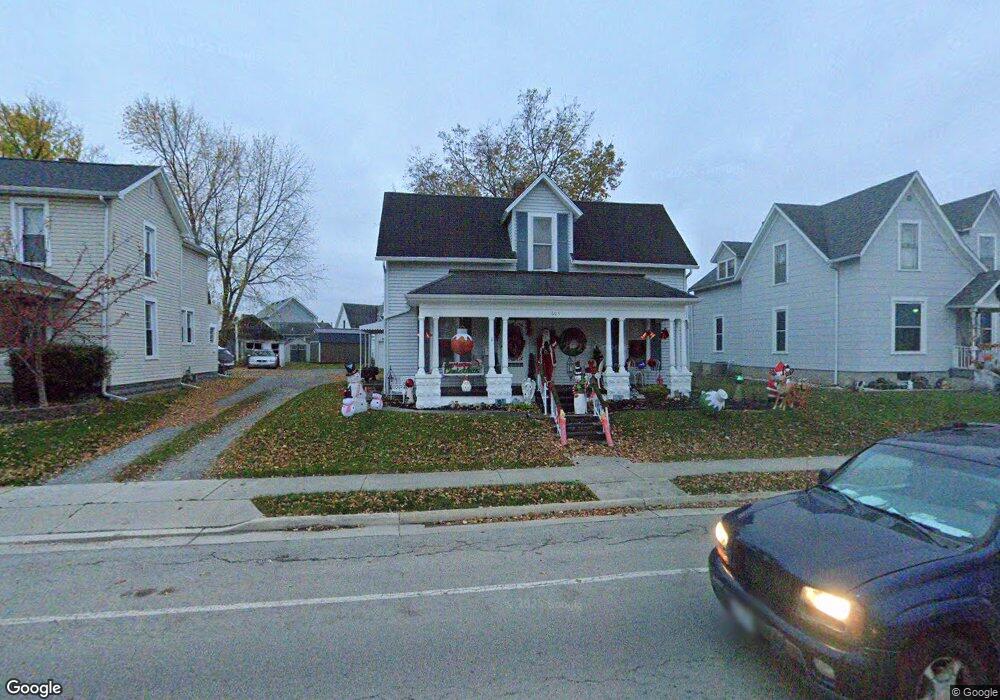
605 Bellefontaine St Wapakoneta, OH 45895
Estimated Value: $143,000 - $177,000
3
Beds
2
Baths
1,584
Sq Ft
$98/Sq Ft
Est. Value
About This Home
This home is located at 605 Bellefontaine St, Wapakoneta, OH 45895 and is currently estimated at $154,861, approximately $97 per square foot. 605 Bellefontaine St is a home located in Auglaize County with nearby schools including Wapakoneta Elementary School, Wapakoneta High School, and Wapakoneta Middle School.
Ownership History
Date
Name
Owned For
Owner Type
Purchase Details
Closed on
Aug 5, 2004
Sold by
Binkley Gary L
Bought by
Holbrook Sherry J
Current Estimated Value
Purchase Details
Closed on
May 17, 2004
Sold by
Harrison Michelle R
Bought by
Binkley Gary L
Purchase Details
Closed on
May 22, 1997
Sold by
Harrison Gordon D
Bought by
Harrison Michelle R
Purchase Details
Closed on
May 15, 1996
Sold by
Cossel Traci L
Bought by
Harrison Gordon D
Purchase Details
Closed on
Apr 29, 1991
Sold by
Mccormick John T
Bought by
Cossel Traci L
Purchase Details
Closed on
Jan 1, 1987
Purchase Details
Closed on
Jan 1, 1985
Create a Home Valuation Report for This Property
The Home Valuation Report is an in-depth analysis detailing your home's value as well as a comparison with similar homes in the area
Home Values in the Area
Average Home Value in this Area
Purchase History
| Date | Buyer | Sale Price | Title Company |
|---|---|---|---|
| Holbrook Sherry J | $72,500 | -- | |
| Binkley Gary L | $75,000 | -- | |
| Harrison Michelle R | -- | -- | |
| Harrison Gordon D | $58,000 | -- | |
| Cossel Traci L | $52,500 | -- | |
| -- | $26,500 | -- | |
| -- | $29,100 | -- |
Source: Public Records
Tax History Compared to Growth
Tax History
| Year | Tax Paid | Tax Assessment Tax Assessment Total Assessment is a certain percentage of the fair market value that is determined by local assessors to be the total taxable value of land and additions on the property. | Land | Improvement |
|---|---|---|---|---|
| 2024 | $1,974 | $40,490 | $6,760 | $33,730 |
| 2023 | $1,363 | $40,490 | $6,760 | $33,730 |
| 2022 | $1,124 | $30,650 | $7,060 | $23,590 |
| 2021 | $1,075 | $30,650 | $7,060 | $23,590 |
| 2020 | $549 | $30,654 | $7,060 | $23,594 |
| 2019 | $923 | $25,169 | $5,796 | $19,373 |
| 2018 | $926 | $25,169 | $5,796 | $19,373 |
| 2017 | $922 | $25,169 | $5,796 | $19,373 |
| 2016 | $952 | $26,107 | $5,492 | $20,615 |
| 2015 | $939 | $26,107 | $5,492 | $20,615 |
| 2014 | $949 | $26,107 | $5,492 | $20,615 |
| 2013 | $966 | $26,107 | $5,492 | $20,615 |
Source: Public Records
Map
Nearby Homes