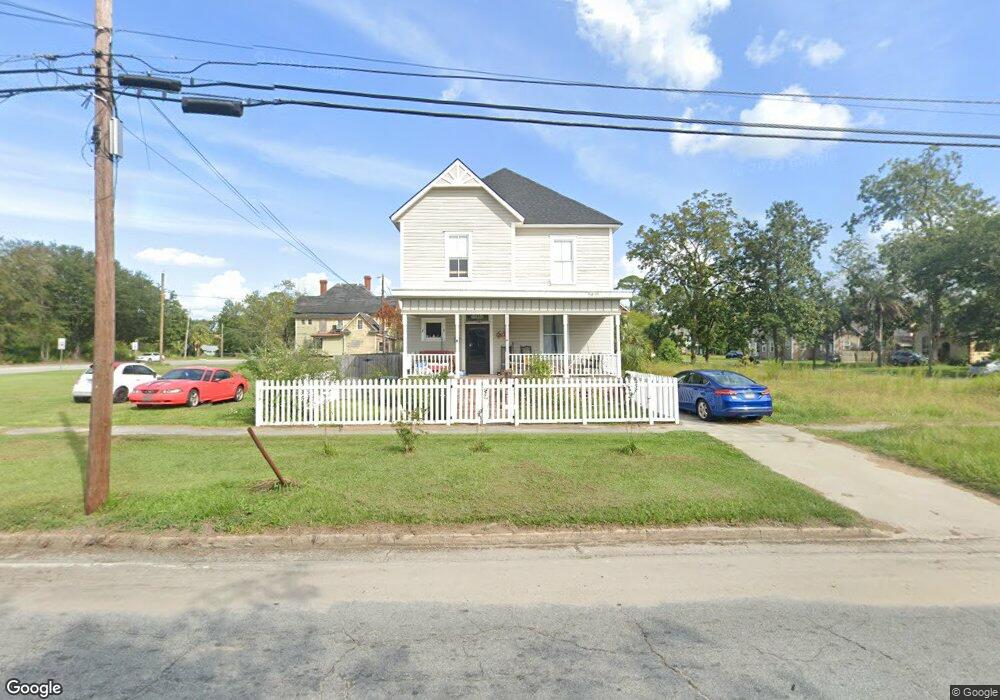
605 Brunel St Waycross, GA 31501
Estimated Value: $143,000 - $208,000
4
Beds
2
Baths
2,184
Sq Ft
$78/Sq Ft
Est. Value
About This Home
This home is located at 605 Brunel St, Waycross, GA 31501 and is currently estimated at $170,742, approximately $78 per square foot. 605 Brunel St is a home located in Ware County with nearby schools including Ruskin Elementary School, Ware County Middle School, and Ware County High School.
Ownership History
Date
Name
Owned For
Owner Type
Purchase Details
Closed on
May 22, 2017
Sold by
Lancaster Caleb M
Bought by
Callahan Pamela S
Current Estimated Value
Home Financials for this Owner
Home Financials are based on the most recent Mortgage that was taken out on this home.
Original Mortgage
$63,000
Outstanding Balance
$52,204
Interest Rate
3.97%
Mortgage Type
New Conventional
Estimated Equity
$118,538
Purchase Details
Closed on
Jun 23, 2008
Sold by
Tillman Charley L
Bought by
Rhea Holly Lynn
Purchase Details
Closed on
Nov 19, 2007
Sold by
Strickland Rosemary
Bought by
Tillman Charley L and Tillman Evelyn
Purchase Details
Closed on
Oct 11, 1990
Bought by
Strickland Rosemary
Create a Home Valuation Report for This Property
The Home Valuation Report is an in-depth analysis detailing your home's value as well as a comparison with similar homes in the area
Home Values in the Area
Average Home Value in this Area
Purchase History
| Date | Buyer | Sale Price | Title Company |
|---|---|---|---|
| Callahan Pamela S | $129,000 | -- | |
| Rhea Holly Lynn | $40,000 | -- | |
| Tillman Charley L | $40,000 | -- | |
| Strickland Rosemary | $30,000 | -- |
Source: Public Records
Mortgage History
| Date | Status | Borrower | Loan Amount |
|---|---|---|---|
| Open | Callahan Pamela S | $63,000 |
Source: Public Records
Tax History Compared to Growth
Tax History
| Year | Tax Paid | Tax Assessment Tax Assessment Total Assessment is a certain percentage of the fair market value that is determined by local assessors to be the total taxable value of land and additions on the property. | Land | Improvement |
|---|---|---|---|---|
| 2024 | $1,254 | $69,390 | $1,190 | $68,200 |
| 2023 | $1,280 | $42,719 | $700 | $42,019 |
| 2022 | $1,428 | $42,719 | $700 | $42,019 |
| 2021 | $1,543 | $35,693 | $700 | $34,993 |
| 2020 | $807 | $18,509 | $700 | $17,809 |
| 2019 | $1,353 | $33,582 | $700 | $32,882 |
| 2018 | $1,427 | $31,977 | $602 | $31,375 |
| 2017 | $715 | $17,890 | $602 | $17,288 |
| 2016 | $715 | $17,890 | $602 | $17,288 |
| 2015 | $720 | $17,889 | $602 | $17,288 |
| 2014 | $719 | $17,890 | $602 | $17,288 |
| 2013 | -- | $17,889 | $602 | $17,287 |
Source: Public Records
Map
Nearby Homes
- 705 Gilmore St
- 805 Brunel St
- 306 Lee Ave
- 418 Reed St
- 615 Morton Ave
- 803 Elizabeth St
- 1021 Lee Ave
- 1304 Brunel St
- 516 Folks St
- 506 McDonald St
- 1103 Ann St
- 503 N Nicholls St
- 505 N Nicholls St
- 629 Remshart St
- 1003 Carswell Ave
- 1125 Georgia St
- 502 Dewey St
- 601 N Nicholls St
- 924 Highsmith St
- 415 Dewey St