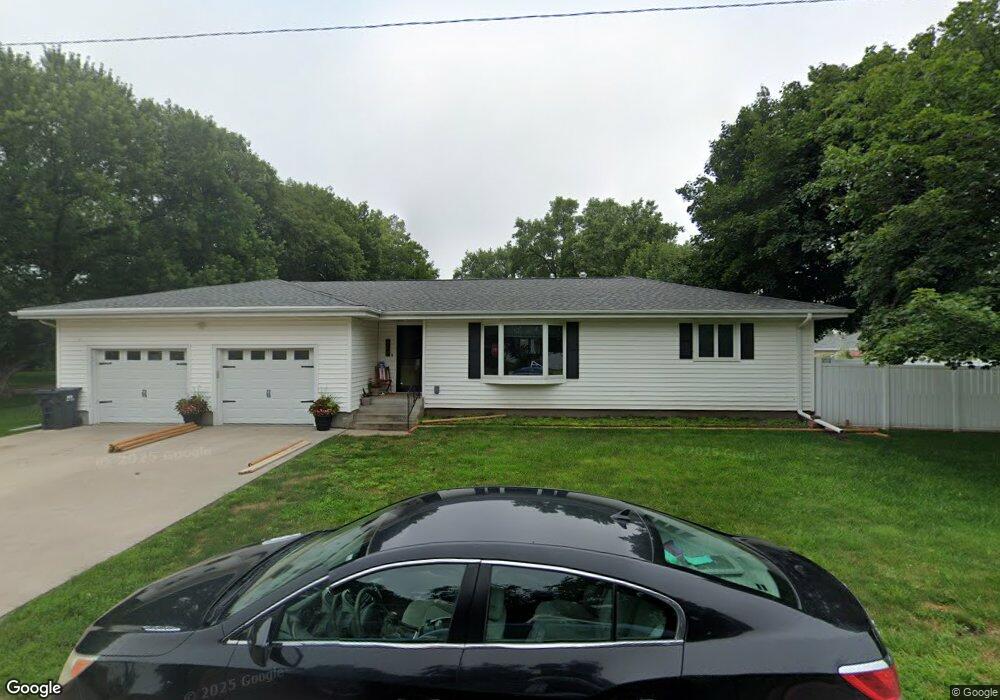
605 Carl St Fullerton, NE 68638
Estimated Value: $129,000 - $190,000
3
Beds
2
Baths
1,140
Sq Ft
$148/Sq Ft
Est. Value
About This Home
This home is located at 605 Carl St, Fullerton, NE 68638 and is currently estimated at $168,462, approximately $147 per square foot. 605 Carl St is a home located in Nance County with nearby schools including Fullerton Elementary School and Fullerton High School.
Ownership History
Date
Name
Owned For
Owner Type
Purchase Details
Closed on
Aug 28, 2021
Sold by
Rasmussen Philip D and Rasmussen Amanda
Bought by
Wood Tyler James
Current Estimated Value
Home Financials for this Owner
Home Financials are based on the most recent Mortgage that was taken out on this home.
Original Mortgage
$165,186
Outstanding Balance
$150,307
Interest Rate
2.8%
Mortgage Type
New Conventional
Estimated Equity
$18,155
Purchase Details
Closed on
Jul 12, 2021
Sold by
Rasmussen Phillip D
Bought by
Wood Tyler James
Home Financials for this Owner
Home Financials are based on the most recent Mortgage that was taken out on this home.
Original Mortgage
$165,186
Outstanding Balance
$150,307
Interest Rate
2.8%
Mortgage Type
New Conventional
Estimated Equity
$18,155
Purchase Details
Closed on
Nov 14, 2016
Bought by
Rasmussen Phillip D and Lipker Amanda
Create a Home Valuation Report for This Property
The Home Valuation Report is an in-depth analysis detailing your home's value as well as a comparison with similar homes in the area
Purchase History
| Date | Buyer | Sale Price | Title Company |
|---|---|---|---|
| Wood Tyler James | $160,000 | None Listed On Document | |
| Wood Tyler James | $160,000 | -- | |
| Rasmussen Phillip D | $95,000 | -- | |
| Belgum Leroy A | -- | -- |
Source: Public Records
Mortgage History
| Date | Status | Borrower | Loan Amount |
|---|---|---|---|
| Open | Wood Tyler James | $165,186 |
Source: Public Records
Tax History
| Year | Tax Paid | Tax Assessment Tax Assessment Total Assessment is a certain percentage of the fair market value that is determined by local assessors to be the total taxable value of land and additions on the property. | Land | Improvement |
|---|---|---|---|---|
| 2025 | $1,936 | $152,020 | $0 | $0 |
| 2024 | $2,022 | $143,050 | $0 | $0 |
| 2023 | $2,132 | $123,095 | $3,265 | $119,830 |
| 2022 | $2,104 | $111,705 | $3,265 | $108,440 |
| 2021 | $1,706 | $93,630 | $3,265 | $90,365 |
| 2020 | $1,600 | $93,630 | $3,265 | $90,365 |
| 2019 | $1,564 | $93,630 | $3,265 | $90,365 |
| 2018 | $1,484 | $93,630 | $3,265 | $90,365 |
| 2017 | $1,226 | $79,275 | $3,265 | $76,010 |
| 2016 | $1,219 | $79,275 | $3,265 | $76,010 |
| 2015 | $1,117 | $70,865 | $3,265 | $67,600 |
| 2014 | -- | $70,865 | $3,265 | $67,600 |
Source: Public Records
Map
Nearby Homes
Your Personal Tour Guide
Ask me questions while you tour the home.