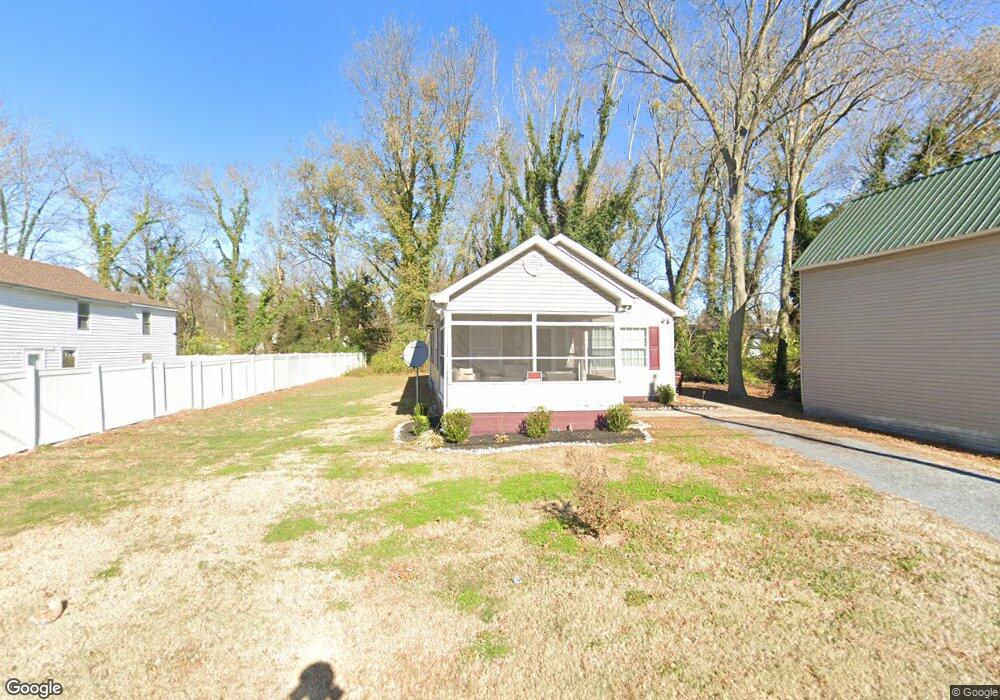
605 Cross St Cambridge, MD 21613
Estimated Value: $109,000 - $178,000
--
Bed
1
Bath
1,104
Sq Ft
$137/Sq Ft
Est. Value
About This Home
This home is located at 605 Cross St, Cambridge, MD 21613 and is currently estimated at $151,414, approximately $137 per square foot. 605 Cross St is a home located in Dorchester County with nearby schools including Maple Elementary School, Mace's Lane Middle School, and Cambridge-South Dorchester High School.
Ownership History
Date
Name
Owned For
Owner Type
Purchase Details
Closed on
Apr 29, 2020
Sold by
Murrill Tyron J
Bought by
Mcnair Walter L and Mcnair Brenda P
Current Estimated Value
Home Financials for this Owner
Home Financials are based on the most recent Mortgage that was taken out on this home.
Original Mortgage
$55,800
Interest Rate
3.2%
Mortgage Type
Commercial
Purchase Details
Closed on
Feb 18, 2009
Sold by
Woolford Russell J and Woolford Mary
Bought by
Woolford Mary E And and Murrill Tyron J
Create a Home Valuation Report for This Property
The Home Valuation Report is an in-depth analysis detailing your home's value as well as a comparison with similar homes in the area
Home Values in the Area
Average Home Value in this Area
Purchase History
| Date | Buyer | Sale Price | Title Company |
|---|---|---|---|
| Mcnair Walter L | $69,295 | None Available | |
| Woolford Mary E And | -- | -- |
Source: Public Records
Mortgage History
| Date | Status | Borrower | Loan Amount |
|---|---|---|---|
| Previous Owner | Mcnair Walter L | $55,800 |
Source: Public Records
Tax History Compared to Growth
Tax History
| Year | Tax Paid | Tax Assessment Tax Assessment Total Assessment is a certain percentage of the fair market value that is determined by local assessors to be the total taxable value of land and additions on the property. | Land | Improvement |
|---|---|---|---|---|
| 2025 | $2,248 | $119,700 | $6,200 | $113,500 |
| 2024 | $1,878 | $110,667 | $0 | $0 |
| 2023 | $1,878 | $101,633 | $0 | $0 |
| 2022 | $1,712 | $92,600 | $6,200 | $86,400 |
| 2021 | $1,746 | $92,600 | $6,200 | $86,400 |
| 2020 | $1,746 | $92,600 | $6,200 | $86,400 |
| 2019 | $1,783 | $93,500 | $6,200 | $87,300 |
| 2018 | $1,738 | $93,500 | $6,200 | $87,300 |
| 2017 | $1,900 | $93,500 | $0 | $0 |
| 2016 | -- | $103,400 | $0 | $0 |
| 2015 | -- | $103,400 | $0 | $0 |
| 2014 | -- | $103,400 | $0 | $0 |
Source: Public Records
Map
Nearby Homes