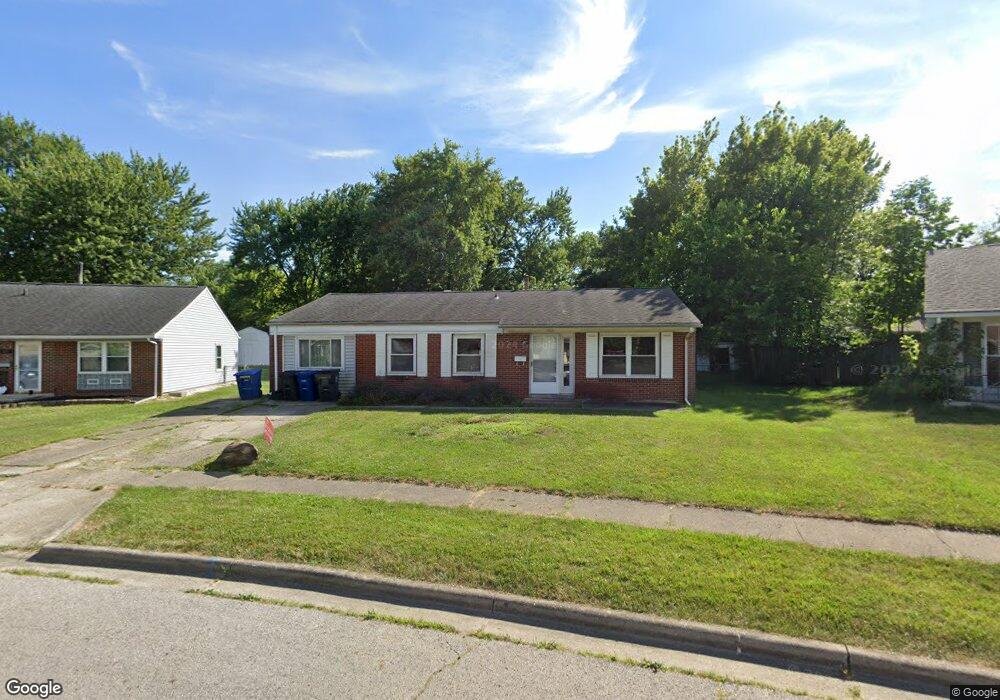
605 Daventry Ln Columbus, OH 43230
Estimated Value: $263,000 - $312,000
3
Beds
2
Baths
1,421
Sq Ft
$198/Sq Ft
Est. Value
About This Home
This home is located at 605 Daventry Ln, Columbus, OH 43230 and is currently estimated at $281,088, approximately $197 per square foot. 605 Daventry Ln is a home located in Franklin County with nearby schools including Royal Manor Elementary School, Gahanna West Middle School, and Lincoln High School.
Ownership History
Date
Name
Owned For
Owner Type
Purchase Details
Closed on
Apr 11, 2014
Sold by
Lakin Jenevie A and Lakin Timothy M
Bought by
Lakin Jenevie A and Lakin Timothy M
Current Estimated Value
Home Financials for this Owner
Home Financials are based on the most recent Mortgage that was taken out on this home.
Original Mortgage
$87,950
Outstanding Balance
$24,258
Interest Rate
4.41%
Mortgage Type
New Conventional
Estimated Equity
$256,830
Purchase Details
Closed on
May 20, 2005
Sold by
Adams Kimberly
Bought by
Lakin Jenevie A
Home Financials for this Owner
Home Financials are based on the most recent Mortgage that was taken out on this home.
Original Mortgage
$96,000
Interest Rate
6.05%
Mortgage Type
Fannie Mae Freddie Mac
Purchase Details
Closed on
Aug 21, 1998
Sold by
Jones Richard O and Jones Terri L
Bought by
Adams Kimberly
Purchase Details
Closed on
Mar 16, 1990
Purchase Details
Closed on
Sep 1, 1981
Create a Home Valuation Report for This Property
The Home Valuation Report is an in-depth analysis detailing your home's value as well as a comparison with similar homes in the area
Purchase History
| Date | Buyer | Sale Price | Title Company |
|---|---|---|---|
| Lakin Jenevie A | -- | First American Title Ins Co | |
| Lakin Jenevie A | $120,000 | -- | |
| Adams Kimberly | $77,000 | Chicago Title | |
| -- | $59,900 | -- | |
| -- | $45,600 | -- |
Source: Public Records
Mortgage History
| Date | Status | Borrower | Loan Amount |
|---|---|---|---|
| Open | Lakin Jenevie A | $87,950 | |
| Closed | Lakin Jenevie A | $96,000 |
Source: Public Records
Tax History
| Year | Tax Paid | Tax Assessment Tax Assessment Total Assessment is a certain percentage of the fair market value that is determined by local assessors to be the total taxable value of land and additions on the property. | Land | Improvement |
|---|---|---|---|---|
| 2025 | $4,623 | $78,470 | $28,000 | $50,470 |
| 2024 | $4,623 | $78,470 | $28,000 | $50,470 |
| 2023 | $4,565 | $78,470 | $28,000 | $50,470 |
| 2022 | $3,775 | $50,550 | $16,140 | $34,410 |
| 2021 | $3,651 | $50,550 | $16,140 | $34,410 |
| 2020 | $3,620 | $50,550 | $16,140 | $34,410 |
| 2019 | $2,974 | $41,440 | $13,440 | $28,000 |
| 2018 | $2,988 | $41,440 | $13,440 | $28,000 |
| 2017 | $2,875 | $41,440 | $13,440 | $28,000 |
| 2016 | $3,020 | $41,760 | $11,900 | $29,860 |
| 2015 | $3,023 | $41,760 | $11,900 | $29,860 |
| 2014 | $3,000 | $41,760 | $11,900 | $29,860 |
| 2013 | $1,489 | $41,755 | $11,900 | $29,855 |
Source: Public Records
Map
Nearby Homes
- 507 Agler Rd
- 221 Lincolnshire Rd
- 162 Imperial Dr
- 2225 Mifflin Blvd
- 730 Penny Ct
- 0 E Aberdeen Ave Unit 226006710
- 0 E Minnesota Ave Unit 224018641
- 3832 Emmons Ave
- 362 Banbury Dr
- 345 Baroness Way
- 0 E Emmons Ave
- 371 Banbury Dr
- 388 Elkwood Place
- 3756 Genessee Ave
- 396 Lincolnshire Rd
- 394 Banbury Dr
- 395 Amesbury Dr
- 424 Lincolnshire Rd
- 427 Canfield Dr
- 2275 Stelzer Rd
- 601 Daventry Ln
- 609 Daventry Ln
- 88 Lincolnshire Rd
- 94 Lincolnshire Rd
- 82 Lincolnshire Rd
- 595 Daventry Ln
- 613 Daventry Ln
- 606 Daventry Ln
- 100 Lincolnshire Rd
- 70 Lincolnshire Rd
- 587 Daventry Ln
- 588 Daventry Ln
- 618 Agler Rd
- 621 King George Ave
- 610 Agler Rd
- 616 Daventry Ln
- 108 Lincolnshire Rd
- 624 Agler Rd
- 591 King George Ave
- 83 Lincolnshire Rd
Your Personal Tour Guide
Ask me questions while you tour the home.