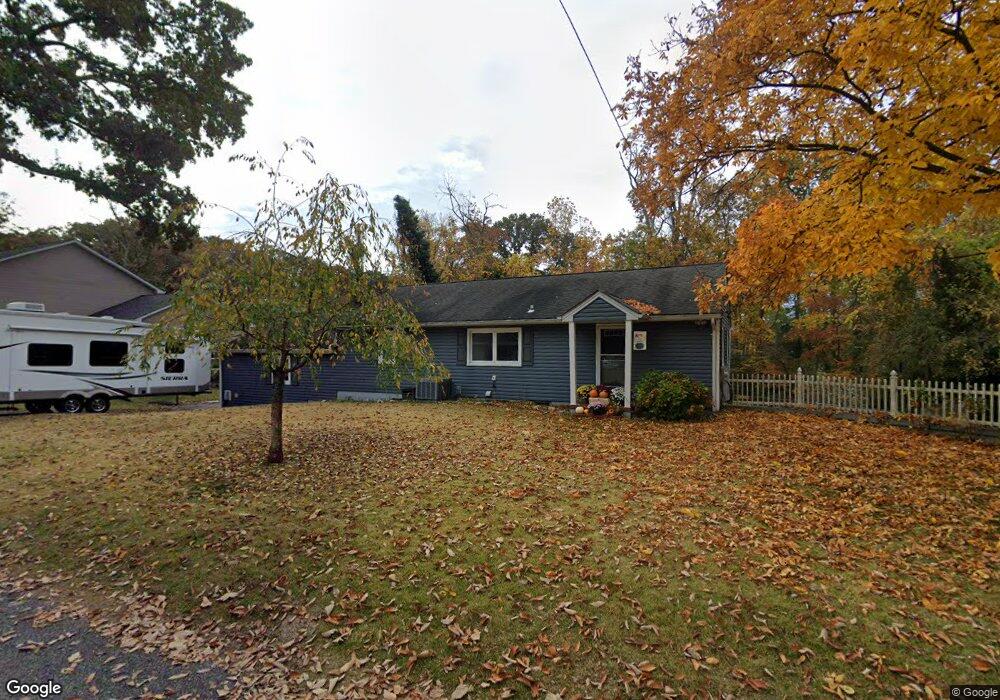
605 Dwight Dr Pasadena, MD 21122
Estimated Value: $443,976 - $481,000
--
Bed
2
Baths
1,170
Sq Ft
$394/Sq Ft
Est. Value
About This Home
This home is located at 605 Dwight Dr, Pasadena, MD 21122 and is currently estimated at $460,494, approximately $393 per square foot. 605 Dwight Dr is a home located in Anne Arundel County with nearby schools including Lake Shore Elementary School, Chesapeake Bay Middle School, and Chesapeake High School.
Ownership History
Date
Name
Owned For
Owner Type
Purchase Details
Closed on
Sep 13, 2004
Sold by
Mangum Donald
Bought by
Milley Rodney D and Milley Michelle M
Current Estimated Value
Purchase Details
Closed on
Jun 22, 2004
Sold by
Chisholm Kristie L
Bought by
Mangum Donald and Mangum Trisha
Purchase Details
Closed on
May 13, 2004
Sold by
Murphy Charles E
Bought by
Chisholm Kristie Lee and Chisholm Brian Alan
Create a Home Valuation Report for This Property
The Home Valuation Report is an in-depth analysis detailing your home's value as well as a comparison with similar homes in the area
Home Values in the Area
Average Home Value in this Area
Purchase History
| Date | Buyer | Sale Price | Title Company |
|---|---|---|---|
| Milley Rodney D | $270,000 | -- | |
| Mangum Donald | $467,500 | -- | |
| Chisholm Kristie Lee | $450,000 | -- |
Source: Public Records
Mortgage History
| Date | Status | Borrower | Loan Amount |
|---|---|---|---|
| Closed | Milley Rodney D | -- |
Source: Public Records
Tax History Compared to Growth
Tax History
| Year | Tax Paid | Tax Assessment Tax Assessment Total Assessment is a certain percentage of the fair market value that is determined by local assessors to be the total taxable value of land and additions on the property. | Land | Improvement |
|---|---|---|---|---|
| 2025 | $3,545 | $335,300 | -- | -- |
| 2024 | $3,545 | $316,500 | $189,200 | $127,300 |
| 2023 | $3,438 | $301,433 | $0 | $0 |
| 2022 | $3,203 | $286,367 | $0 | $0 |
| 2021 | $6,276 | $271,300 | $155,000 | $116,300 |
| 2020 | $3,051 | $271,300 | $155,000 | $116,300 |
| 2019 | $3,007 | $271,300 | $155,000 | $116,300 |
| 2018 | $3,004 | $296,300 | $169,200 | $127,100 |
| 2017 | $2,849 | $273,800 | $0 | $0 |
| 2016 | -- | $251,300 | $0 | $0 |
| 2015 | -- | $228,800 | $0 | $0 |
| 2014 | -- | $228,700 | $0 | $0 |
Source: Public Records
Map
Nearby Homes