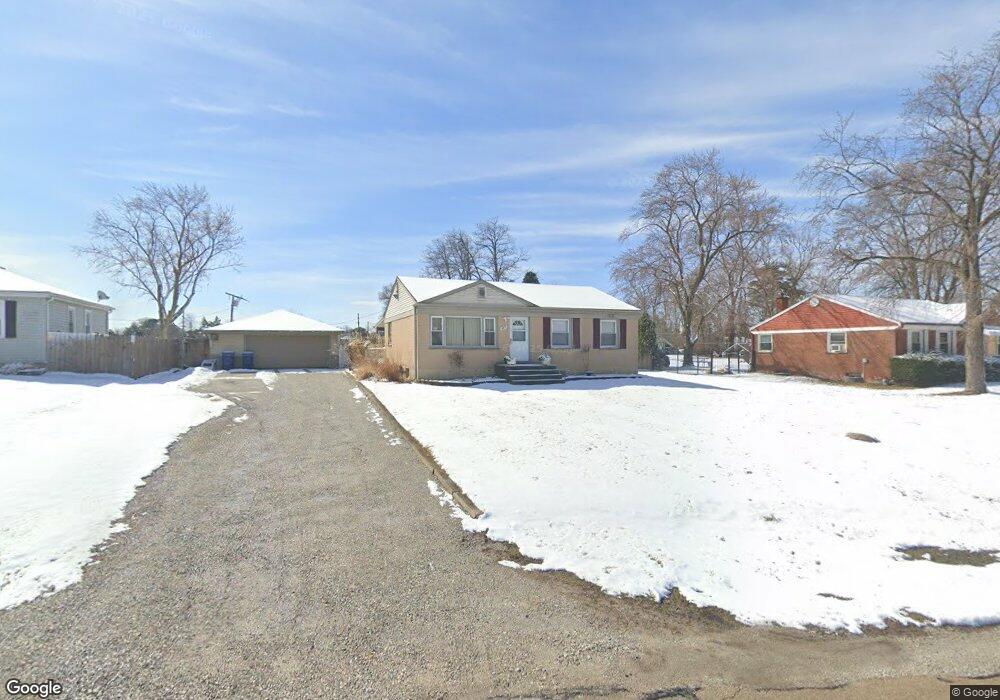
605 E Riordan Rd Villa Park, IL 60181
Estimated Value: $327,000 - $398,000
--
Bed
--
Bath
1,092
Sq Ft
$328/Sq Ft
Est. Value
About This Home
This home is located at 605 E Riordan Rd, Villa Park, IL 60181 and is currently estimated at $358,126, approximately $327 per square foot. 605 E Riordan Rd is a home located in DuPage County with nearby schools including Salt Creek Elementary School, John E Albright Middle School, and Stella May Swartz Elementary School.
Ownership History
Date
Name
Owned For
Owner Type
Purchase Details
Closed on
Jan 6, 2024
Sold by
Vojackova Pavlina
Bought by
Ruman-Vojackova Revocable Trust and Vojackova
Current Estimated Value
Purchase Details
Closed on
Sep 13, 2005
Sold by
Szulewski Robert
Bought by
Vojackova Pavlina
Home Financials for this Owner
Home Financials are based on the most recent Mortgage that was taken out on this home.
Original Mortgage
$220,000
Interest Rate
7.35%
Mortgage Type
Fannie Mae Freddie Mac
Purchase Details
Closed on
Mar 31, 2003
Sold by
Lara Richard A and Frank A Krenzel Trust
Bought by
Szulewski Robert
Home Financials for this Owner
Home Financials are based on the most recent Mortgage that was taken out on this home.
Original Mortgage
$176,700
Interest Rate
5.76%
Purchase Details
Closed on
Sep 18, 2000
Sold by
Krenzel Frank A
Bought by
Krenzel Frank A and Lara Richard A
Create a Home Valuation Report for This Property
The Home Valuation Report is an in-depth analysis detailing your home's value as well as a comparison with similar homes in the area
Home Values in the Area
Average Home Value in this Area
Purchase History
| Date | Buyer | Sale Price | Title Company |
|---|---|---|---|
| Ruman-Vojackova Revocable Trust | -- | None Listed On Document | |
| Vojackova Pavlina | $275,000 | Marquis Title Insurance Co | |
| Szulewski Robert | $186,000 | Pntn | |
| Krenzel Frank A | -- | -- |
Source: Public Records
Mortgage History
| Date | Status | Borrower | Loan Amount |
|---|---|---|---|
| Previous Owner | Vojackova Pavlina | $220,000 | |
| Previous Owner | Szulewski Robert | $176,700 |
Source: Public Records
Tax History Compared to Growth
Tax History
| Year | Tax Paid | Tax Assessment Tax Assessment Total Assessment is a certain percentage of the fair market value that is determined by local assessors to be the total taxable value of land and additions on the property. | Land | Improvement |
|---|---|---|---|---|
| 2024 | $5,325 | $99,099 | $56,611 | $42,488 |
| 2023 | $4,755 | $91,640 | $52,350 | $39,290 |
| 2022 | $4,627 | $88,090 | $50,320 | $37,770 |
| 2021 | $4,607 | $85,900 | $49,070 | $36,830 |
| 2020 | $4,508 | $84,010 | $47,990 | $36,020 |
| 2019 | $4,273 | $79,880 | $45,630 | $34,250 |
| 2018 | $4,205 | $74,860 | $42,760 | $32,100 |
| 2017 | $4,111 | $71,340 | $40,750 | $30,590 |
| 2016 | $3,789 | $67,210 | $38,390 | $28,820 |
| 2015 | $3,727 | $62,610 | $35,760 | $26,850 |
| 2014 | $4,407 | $72,190 | $39,950 | $32,240 |
| 2013 | $4,131 | $73,200 | $40,510 | $32,690 |
Source: Public Records
Map
Nearby Homes
- 625 E Van Buren St
- 0S639 Summit Ave
- 1046 E Van Buren St
- 650 E Van Buren St
- 1S150 Spring Rd Unit 5B
- 1S150 Spring Rd Unit 4L
- 1S325 Buttercup Ln
- 4 Waldorf Ct
- 1 Oak Brook Club Dr Unit A105
- 1 Oak Brook Club Dr Unit A301
- 1 Oak Brook Club Dr Unit A312
- 2 Ardmore Ave
- 1500 S Ardmore Ave Unit 408
- 5 Oak Brook Club Dr Unit N305
- 818 S Villa Ave
- 1S518 Macarthur Dr
- 2 S Atrium Way Unit 203
- 727 S Oakland Ave
- 963 S Saylor Ave
- 328 Walnut Ln
- 575 E Riordan Rd
- 600 E Riordan Rd
- 555 E Riordan Rd
- 580 E Riordan Rd
- 560 E Riordan Rd
- 1455 S Monterey Ave
- 1475 S Monterey Ave
- 1435 S Monterey Ave
- 1505 S Monterey Ave
- 17w W Roosevelt Rd
- 540 E Riordan Rd
- 1425 S Monterey Ave
- 1535 S Monterey Ave
- 1555 S Monterey Ave
- 1440 S Monterey Ave
- 1420 S Wayside Dr
- 1450 S Monterey Ave
- 1430 S Monterey Ave
- 1500 S Monterey Ave