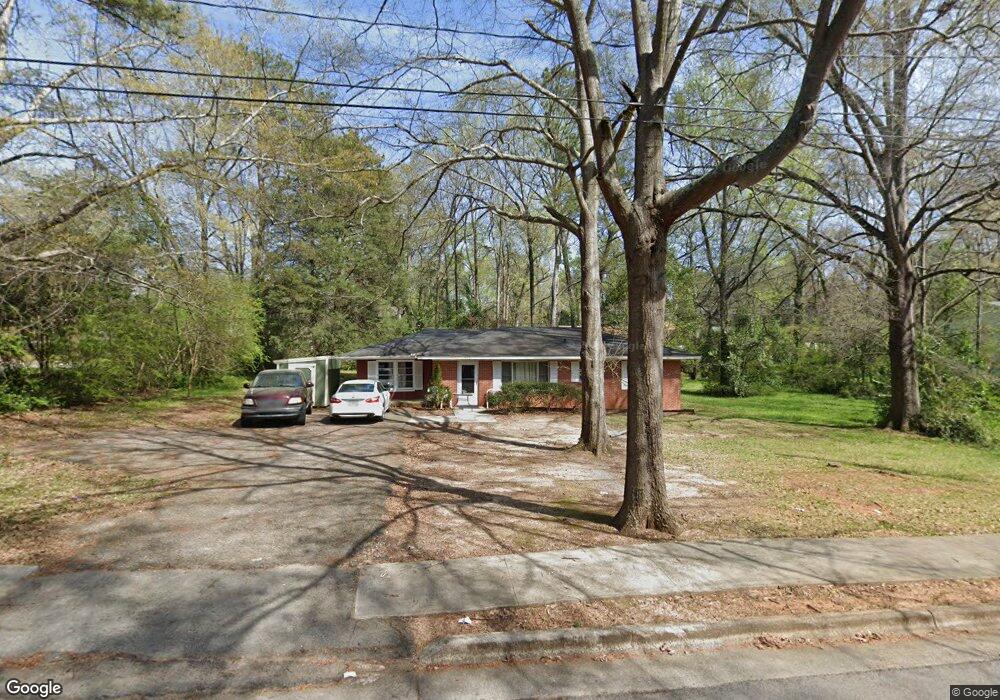
605 Elm St Lagrange, GA 30240
Estimated Value: $123,598 - $200,000
3
Beds
1
Bath
1,277
Sq Ft
$127/Sq Ft
Est. Value
About This Home
This home is located at 605 Elm St, Lagrange, GA 30240 and is currently estimated at $162,400, approximately $127 per square foot. 605 Elm St is a home located in Troup County with nearby schools including Ethel W. Kight Elementary School, Hollis Hand Elementary School, and Franklin Forest Elementary School.
Ownership History
Date
Name
Owned For
Owner Type
Purchase Details
Closed on
Mar 10, 2021
Sold by
Daniel Linda Morrow Estate
Bought by
Daniel William Oneal
Current Estimated Value
Purchase Details
Closed on
May 15, 2003
Sold by
Daniel Neal
Bought by
Daniel William O and Daniel Linda M
Purchase Details
Closed on
Feb 28, 2003
Sold by
First Family Finan
Bought by
Daniel Neal
Purchase Details
Closed on
Sep 3, 2002
Sold by
Wanda Davison
Bought by
First Family Finan
Purchase Details
Closed on
Jul 25, 1997
Sold by
Walburn Myrtle Elizabeth Tucke
Bought by
Wanda Davison
Purchase Details
Closed on
Oct 13, 1977
Sold by
Walburn Jesse F and Walburn Myrtle E
Bought by
Walburn Myrtle Elizabeth Tucke
Purchase Details
Closed on
Oct 12, 1977
Sold by
Walburn Jesse F Interest
Bought by
Walburn Jesse F and Walburn Myrtle E
Purchase Details
Closed on
Mar 1, 1956
Sold by
Callaway Community Fdn
Bought by
Walburn Jesse F Interest
Create a Home Valuation Report for This Property
The Home Valuation Report is an in-depth analysis detailing your home's value as well as a comparison with similar homes in the area
Purchase History
| Date | Buyer | Sale Price | Title Company |
|---|---|---|---|
| Daniel William Oneal | -- | -- | |
| Daniel William O | -- | -- | |
| Daniel Neal | $41,500 | -- | |
| First Family Finan | $46,500 | -- | |
| Wanda Davison | $57,900 | -- | |
| Walburn Myrtle Elizabeth Tucke | -- | -- | |
| Walburn Jesse F | -- | -- | |
| Walburn Jesse F Interest | -- | -- |
Source: Public Records
Tax History
| Year | Tax Paid | Tax Assessment Tax Assessment Total Assessment is a certain percentage of the fair market value that is determined by local assessors to be the total taxable value of land and additions on the property. | Land | Improvement |
|---|---|---|---|---|
| 2025 | $1,127 | $41,316 | $4,680 | $36,636 |
| 2024 | $1,037 | $38,036 | $4,680 | $33,356 |
| 2023 | $922 | $33,796 | $4,680 | $29,116 |
| 2022 | $899 | $32,196 | $4,680 | $27,516 |
| 2021 | $752 | $24,928 | $4,680 | $20,248 |
| 2020 | $752 | $24,928 | $4,680 | $20,248 |
| 2019 | $691 | $22,916 | $4,680 | $18,236 |
| 2018 | $615 | $20,396 | $4,680 | $15,716 |
| 2017 | $615 | $20,396 | $4,680 | $15,716 |
| 2016 | $608 | $20,156 | $4,680 | $15,476 |
| 2015 | $609 | $20,156 | $4,680 | $15,476 |
| 2014 | $585 | $19,341 | $4,680 | $14,661 |
| 2013 | -- | $20,659 | $4,700 | $15,959 |
Source: Public Records
Map
Nearby Homes
Your Personal Tour Guide
Ask me questions while you tour the home.