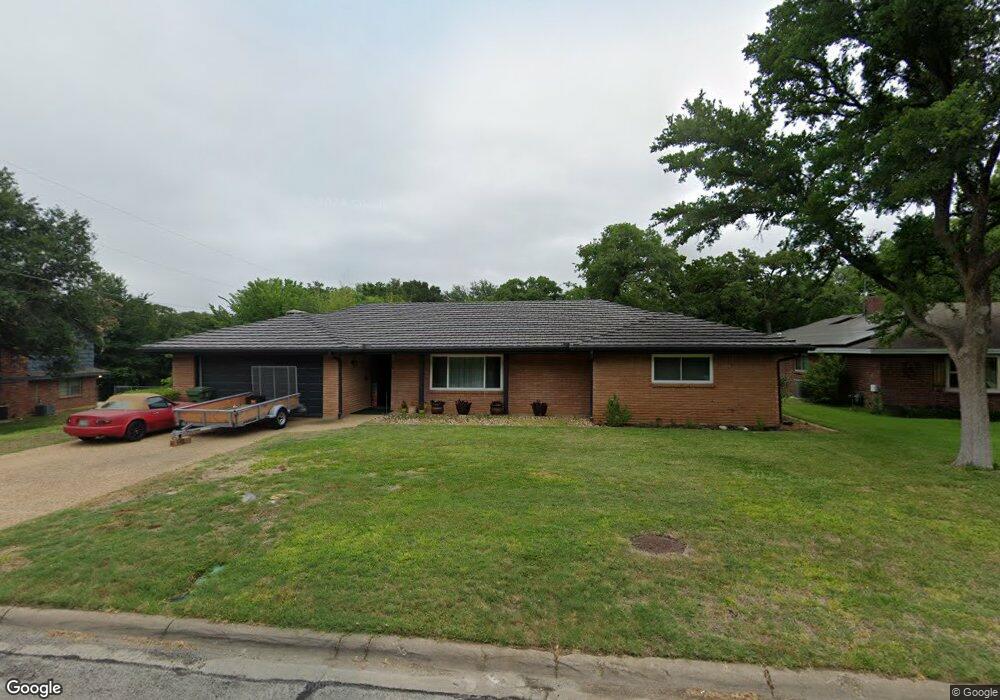
605 Evandale Dr Bedford, TX 76022
Estimated Value: $360,000 - $411,000
3
Beds
2
Baths
2,127
Sq Ft
$185/Sq Ft
Est. Value
About This Home
This home is located at 605 Evandale Dr, Bedford, TX 76022 and is currently estimated at $393,931, approximately $185 per square foot. 605 Evandale Dr is a home located in Tarrant County with nearby schools including Stonegate Elementary School, Central J High School, and L.D. Bell High School.
Ownership History
Date
Name
Owned For
Owner Type
Purchase Details
Closed on
Aug 24, 2017
Sold by
Mcmakin Judith and Mcmakin Michael
Bought by
Gomez Tony and Gomez Esther Marie
Current Estimated Value
Home Financials for this Owner
Home Financials are based on the most recent Mortgage that was taken out on this home.
Original Mortgage
$155,000
Outstanding Balance
$106,801
Interest Rate
4.03%
Mortgage Type
New Conventional
Estimated Equity
$287,130
Purchase Details
Closed on
Jun 26, 2009
Sold by
Tatsak John and Tatsak Jeanette M
Bought by
Mcmakin Michael and Mcmakin Judith
Home Financials for this Owner
Home Financials are based on the most recent Mortgage that was taken out on this home.
Original Mortgage
$122,800
Interest Rate
4.84%
Mortgage Type
Purchase Money Mortgage
Purchase Details
Closed on
Sep 12, 1996
Sold by
Tatsak John and Tatsak Jeannette M
Bought by
Tatsak John and Tatsak Jeannette M
Create a Home Valuation Report for This Property
The Home Valuation Report is an in-depth analysis detailing your home's value as well as a comparison with similar homes in the area
Home Values in the Area
Average Home Value in this Area
Purchase History
| Date | Buyer | Sale Price | Title Company |
|---|---|---|---|
| Gomez Tony | -- | None Available | |
| Mcmakin Michael | -- | Rattikin Title | |
| Tatsak John | -- | -- |
Source: Public Records
Mortgage History
| Date | Status | Borrower | Loan Amount |
|---|---|---|---|
| Open | Gomez Tony | $155,000 | |
| Previous Owner | Mcmakin Michael | $122,800 |
Source: Public Records
Tax History Compared to Growth
Tax History
| Year | Tax Paid | Tax Assessment Tax Assessment Total Assessment is a certain percentage of the fair market value that is determined by local assessors to be the total taxable value of land and additions on the property. | Land | Improvement |
|---|---|---|---|---|
| 2025 | $3,954 | $356,639 | $75,000 | $281,639 |
| 2024 | $3,954 | $356,639 | $75,000 | $281,639 |
| 2023 | $4,633 | $365,178 | $55,000 | $310,178 |
| 2022 | $4,797 | $316,139 | $55,000 | $261,139 |
| 2021 | $4,703 | $277,535 | $55,000 | $222,535 |
| 2020 | $4,315 | $248,816 | $55,000 | $193,816 |
| 2019 | $4,008 | $165,000 | $55,000 | $110,000 |
| 2018 | $3,627 | $165,000 | $30,000 | $135,000 |
| 2017 | $4,323 | $208,117 | $30,000 | $178,117 |
| 2016 | $3,930 | $179,465 | $30,000 | $149,465 |
| 2015 | $3,434 | $147,700 | $20,000 | $127,700 |
| 2014 | $3,434 | $147,700 | $20,000 | $127,700 |
Source: Public Records
Map
Nearby Homes
- 604 Donna Ln
- 1416 Wade Dr
- 1108 Wade Dr
- 501 Merrill Dr
- 1213 Briar Dr
- 1236 King Dr
- 933 Wade Dr
- 1204 Edgecliff Dr
- 1008 Russell Ln
- 49 Coffee Tavern Rd
- 1112 Ann St
- 1004 Overhill Dr
- 344 Bedford Ct E
- 921 Overhill Dr
- 909 Overhill Dr
- 341 Hurst Dr
- 849 Russell Ln
- 345 Somerset Cir
- 832 Chateau Valee Cir
- 258 Somerset Terrace