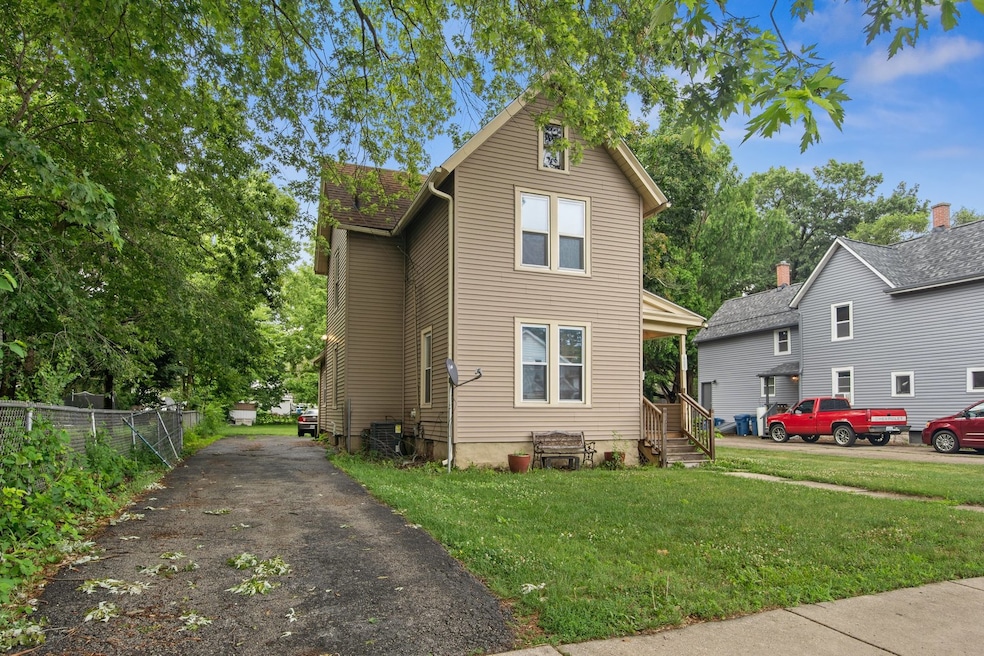


605 Iowa Ave Aurora, IL 60506
Near West Galena NeighborhoodEstimated payment $1,696/month
Highlights
- Mature Trees
- Den
- Living Room
- Traditional Architecture
- Formal Dining Room
- Laundry Room
About This Home
Welcome home to this three bedroom, single-family home full of potential! The main floor features a spacious living room, a separate dining room, and a den that can be used as an additional bedroom or home office. The kitchen offers plenty of cabinet space and a convenient island. Upstairs, you'll find three generously sized bedrooms and a full bath. Enjoy a large yard and a charming front porch. A long driveway provides ample parking space and plenty of room for a garage! Conveniently located near stores, restaurants, the Metra train, downtown and public transportation!
Home Details
Home Type
- Single Family
Est. Annual Taxes
- $5,108
Year Built
- Built in 1900
Lot Details
- 10,454 Sq Ft Lot
- Lot Dimensions are 53x197
- Mature Trees
Parking
- Driveway
Home Design
- Traditional Architecture
- Asphalt Roof
Interior Spaces
- 1,550 Sq Ft Home
- 2-Story Property
- Ceiling Fan
- Family Room
- Living Room
- Formal Dining Room
- Den
- Basement Fills Entire Space Under The House
- Carbon Monoxide Detectors
- Range
- Laundry Room
Flooring
- Carpet
- Laminate
Bedrooms and Bathrooms
- 3 Bedrooms
- 3 Potential Bedrooms
- 2 Full Bathrooms
Utilities
- Forced Air Heating and Cooling System
- Heating System Uses Natural Gas
Listing and Financial Details
- Homeowner Tax Exemptions
Map
Home Values in the Area
Average Home Value in this Area
Tax History
| Year | Tax Paid | Tax Assessment Tax Assessment Total Assessment is a certain percentage of the fair market value that is determined by local assessors to be the total taxable value of land and additions on the property. | Land | Improvement |
|---|---|---|---|---|
| 2024 | $5,108 | $72,511 | $10,607 | $61,904 |
| 2023 | $4,864 | $64,788 | $9,477 | $55,311 |
| 2022 | $4,518 | $57,045 | $8,647 | $48,398 |
| 2021 | $4,304 | $53,109 | $8,050 | $45,059 |
| 2020 | $4,056 | $49,330 | $7,477 | $41,853 |
| 2019 | $3,883 | $45,706 | $6,928 | $38,778 |
| 2018 | $3,574 | $41,797 | $6,408 | $35,389 |
| 2017 | $3,416 | $39,189 | $5,904 | $33,285 |
| 2016 | $3,022 | $34,449 | $5,061 | $29,388 |
| 2015 | -- | $30,076 | $4,352 | $25,724 |
| 2014 | -- | $28,073 | $4,186 | $23,887 |
| 2013 | -- | $28,514 | $4,126 | $24,388 |
Property History
| Date | Event | Price | Change | Sq Ft Price |
|---|---|---|---|---|
| 08/18/2025 08/18/25 | Pending | -- | -- | -- |
| 08/04/2025 08/04/25 | Price Changed | $234,900 | -2.1% | $152 / Sq Ft |
| 07/24/2025 07/24/25 | Price Changed | $239,900 | -2.0% | $155 / Sq Ft |
| 07/10/2025 07/10/25 | For Sale | $244,900 | 0.0% | $158 / Sq Ft |
| 07/05/2025 07/05/25 | Pending | -- | -- | -- |
| 06/25/2025 06/25/25 | For Sale | $244,900 | -- | $158 / Sq Ft |
Purchase History
| Date | Type | Sale Price | Title Company |
|---|---|---|---|
| Interfamily Deed Transfer | -- | None Available | |
| Interfamily Deed Transfer | -- | North American Title Co | |
| Warranty Deed | $116,000 | Residential Title Services | |
| Interfamily Deed Transfer | -- | -- |
Mortgage History
| Date | Status | Loan Amount | Loan Type |
|---|---|---|---|
| Open | $161,600 | New Conventional | |
| Closed | $15,600 | Unknown | |
| Closed | $117,181 | FHA | |
| Previous Owner | $114,542 | FHA |
Source: Midwest Real Estate Data (MRED)
MLS Number: 12402551
APN: 15-16-477-012
Disclaimer: Certain information contained herein is derived from information provided by parties other than Homes.com. All information provided is deemed reliable, but is not guaranteed to be accurate and should be independently verified.
![]() Based on information submitted to the MLS GRID. All data is obtained from various sources and may not have been verified by broker or MLS GRID. Supplied Open House Information is subject to change without notice. All information should be independently reviewed and verified for accuracy. Properties may or may not be listed by the office/agent presenting the information. Some IDX listings have been excluded from this website.
Based on information submitted to the MLS GRID. All data is obtained from various sources and may not have been verified by broker or MLS GRID. Supplied Open House Information is subject to change without notice. All information should be independently reviewed and verified for accuracy. Properties may or may not be listed by the office/agent presenting the information. Some IDX listings have been excluded from this website.
The Digital Millennium Copyright Act of 1998, 17 U.S.C. § 512 (the “DMCA”) provides recourse for copyright owners who believe that material appearing on the Internet infringes their rights under U.S. copyright law. If you believe in good faith that any content or material made available in connection with our website or services infringes your copyright, you (or your agent) may send us a notice requesting that the content or material be removed, or access to it blocked.
Notices must be sent in writing by email to DMCAnotice@MLSGrid.com.
The DMCA requires that your notice of alleged copyright infringement include the following information:
(1) description of the copyrighted work that is the subject of claimed infringement;
(2) description of the alleged infringing content and information sufficient to permit us to locate the content;
(3) contact information for you, including your address, telephone number and email address;
(4) a statement by you that you have a good faith belief that the content in the manner complained of is not authorized by the copyright owner, or its agent, or by the operation of any law;
(5) a statement by you, signed under penalty of perjury, that the information in the notification is accurate and that you have the authority to enforce the copyrights that are claimed to be infringed; and
(6) a physical or electronic signature of the copyright owner or a person authorized to act on the copyright owner’s behalf. Failure to include all of the above information may result in the delay of the processing of your complaint.
- 519 N View St
- 255 Plum St
- 719 Oak Ave
- 468 Wilder St
- 518 W Park Ave
- 222 Grand Ave
- 208 Blackhawk St
- 826 N May St
- 216 N May St
- 808 Gillette Ave
- 523 Spruce St
- 544 Charles St
- 932 W New York St
- 950 Pennsylvania Ave
- 563 California Ave
- 523 W Downer Place
- 450 W Downer Place Unit C
- 65 S May St
- 558 W Downer Place
- 1045 Palace St
