Estimated Value: $281,000 - $298,000
4
Beds
2
Baths
1,951
Sq Ft
$149/Sq Ft
Est. Value
About This Home
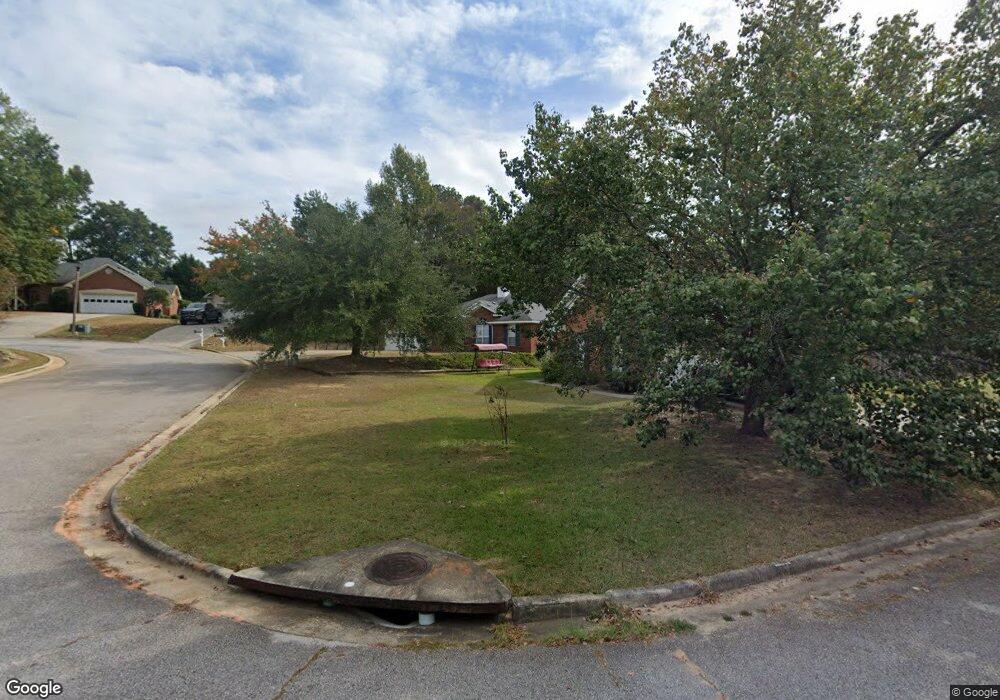
This home is located at 605 Kimberly Place, Evans, GA 30809 and is currently estimated at $289,861, approximately $148 per square foot. 605 Kimberly Place is a home located in Columbia County with nearby schools including Evans Elementary School, John F. Kennedy Middle School, and Evans Middle School.
Ownership History
Date
Name
Owned For
Owner Type
Purchase Details
Closed on
Jun 30, 2020
Sold by
Franco Debra D
Bought by
Sdf Homes 2 Llc
Current Estimated Value
Purchase Details
Closed on
Oct 22, 2007
Sold by
Walnut Hill Land Conservation Trust
Bought by
Franco Debra D
Home Financials for this Owner
Home Financials are based on the most recent Mortgage that was taken out on this home.
Original Mortgage
$131,200
Interest Rate
6.27%
Mortgage Type
New Conventional
Purchase Details
Closed on
Nov 6, 2002
Sold by
Sankey August R
Bought by
Sankey August R and Sankey Sharon
Home Financials for this Owner
Home Financials are based on the most recent Mortgage that was taken out on this home.
Original Mortgage
$98,217
Interest Rate
6.08%
Mortgage Type
VA
Create a Home Valuation Report for This Property
The Home Valuation Report is an in-depth analysis detailing your home's value as well as a comparison with similar homes in the area
Home Values in the Area
Average Home Value in this Area
Purchase History
| Date | Buyer | Sale Price | Title Company |
|---|---|---|---|
| Sdf Homes 2 Llc | -- | -- | |
| Franco Debra D | $164,000 | -- | |
| Sankey August R | -- | -- |
Source: Public Records
Mortgage History
| Date | Status | Borrower | Loan Amount |
|---|---|---|---|
| Previous Owner | Franco Debra D | $131,200 | |
| Previous Owner | Sankey August R | $98,217 |
Source: Public Records
Tax History Compared to Growth
Tax History
| Year | Tax Paid | Tax Assessment Tax Assessment Total Assessment is a certain percentage of the fair market value that is determined by local assessors to be the total taxable value of land and additions on the property. | Land | Improvement |
|---|---|---|---|---|
| 2025 | $2,697 | $110,618 | $20,604 | $90,014 |
| 2024 | $2,969 | $116,498 | $22,204 | $94,294 |
| 2023 | $2,969 | $95,739 | $18,904 | $76,835 |
| 2022 | $2,437 | $91,519 | $19,304 | $72,215 |
| 2021 | $2,218 | $79,441 | $14,804 | $64,637 |
| 2020 | $2,143 | $75,074 | $14,604 | $60,470 |
| 2019 | $2,029 | $70,946 | $14,504 | $56,442 |
| 2018 | $2,092 | $72,982 | $14,104 | $58,878 |
| 2017 | $2,058 | $71,509 | $13,904 | $57,605 |
| 2016 | $1,931 | $69,474 | $13,980 | $55,494 |
| 2015 | $1,867 | $66,970 | $11,880 | $55,090 |
| 2014 | $1,846 | $65,362 | $11,880 | $53,482 |
Source: Public Records
Map
Nearby Homes
- 599 Windward Ct
- 604 Kimberley Place
- 604 Barberry Ct
- 4648 Leeward Dr
- 4709 Walnut Hill Dr
- 4670 La Pointe
- 4664 La Pointe
- 646 Wellington Dr
- 4746 Rye Hill Ct
- 702 Rye Hill Dr
- 3465 Hilltop Trail
- 654 Whitney Shoals Rd
- 4136 Buffalo Trail
- 703 Low Meadow Dr
- 4614 Stoneridge Ct
- 586 Gibbs Rd
- 4560 Mulberry Creek Dr
- 2975 Rosewood Dr
- 726 Whitney Shoals Rd
- 4653 Washington Rd
- 607 Kimberly Place
- 603 Kimberly Place
- 609 Kimberly Place
- 602 Barberry Ct
- 611 Kimberly Place
- 602 Kimberley Place
- 604 Kimberly Place
- 597 Windward Ct
- 602 Kimberly Place
- 613 Kimberly Place
- 587 Windward Ct
- 608 Kimberly Place
- 4679 Walnut Hill Dr
- 585 Windward Ct
- 606 Barberry Ct
- 610 Kimberly Place
- 610 Kimberley Place
- 615 Kimberly Place
- 598 Windward Ct
- 4681 Walnut Hill Dr