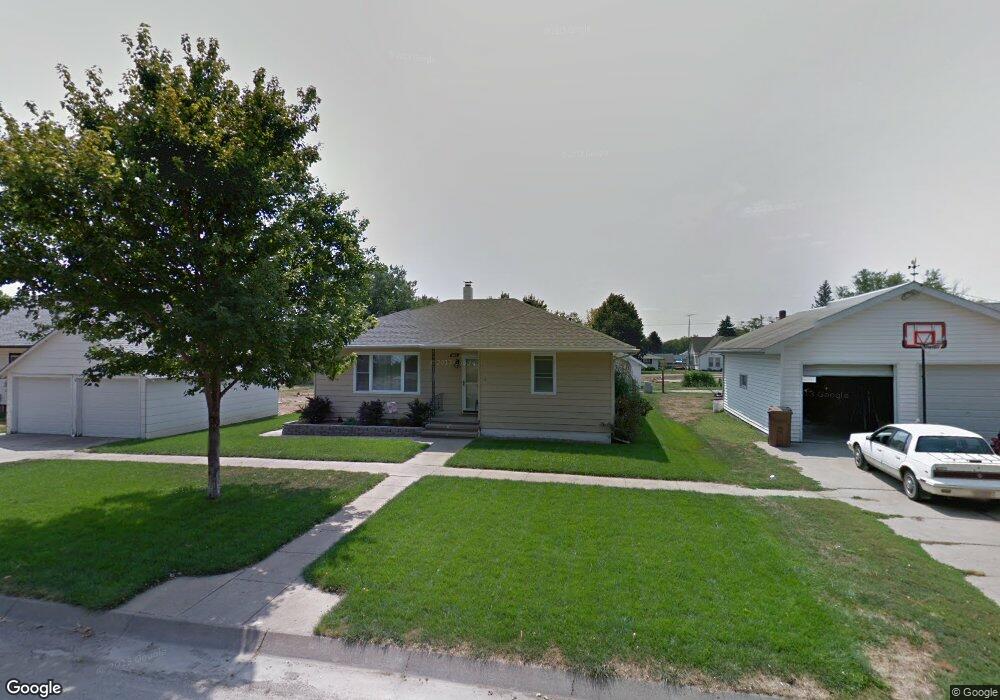
605 Locust St Stanton, NE 68779
Estimated Value: $189,541 - $262,000
Studio
2
Baths
1,092
Sq Ft
$203/Sq Ft
Est. Value
About This Home
This home is located at 605 Locust St, Stanton, NE 68779 and is currently estimated at $221,385, approximately $202 per square foot. 605 Locust St is a home located in Stanton County with nearby schools including Stanton Elementary School, Stanton High School, and St. Johns Lutheran School.
Ownership History
Date
Name
Owned For
Owner Type
Purchase Details
Closed on
Jul 25, 2006
Sold by
Chase Jeffrey P and Chase Charissa A
Bought by
Robinette Lance M and Bohlken Kari J
Current Estimated Value
Home Financials for this Owner
Home Financials are based on the most recent Mortgage that was taken out on this home.
Original Mortgage
$56,600
Outstanding Balance
$33,191
Interest Rate
6.62%
Mortgage Type
New Conventional
Estimated Equity
$188,194
Create a Home Valuation Report for This Property
The Home Valuation Report is an in-depth analysis detailing your home's value as well as a comparison with similar homes in the area
Purchase History
| Date | Buyer | Sale Price | Title Company |
|---|---|---|---|
| Robinette Lance M | $57,004 | None Available |
Source: Public Records
Mortgage History
| Date | Status | Borrower | Loan Amount |
|---|---|---|---|
| Open | Robinette Lance M | $56,600 |
Source: Public Records
Tax History
| Year | Tax Paid | Tax Assessment Tax Assessment Total Assessment is a certain percentage of the fair market value that is determined by local assessors to be the total taxable value of land and additions on the property. | Land | Improvement |
|---|---|---|---|---|
| 2025 | $1,513 | $164,225 | $9,410 | $154,815 |
| 2024 | $2,596 | $182,940 | $4,720 | $178,220 |
| 2023 | $2,596 | $169,390 | $4,370 | $165,020 |
| 2022 | $2,012 | $123,780 | $4,370 | $119,410 |
| 2021 | $1,889 | $113,465 | $4,370 | $109,095 |
| 2020 | $1,642 | $97,125 | $4,370 | $92,755 |
| 2019 | $1,498 | $87,685 | $3,360 | $84,325 |
| 2018 | $1,428 | $87,685 | $3,360 | $84,325 |
| 2017 | $1,365 | $87,685 | $3,360 | $84,325 |
| 2016 | $878 | $0 | $0 | $0 |
| 2015 | $864 | $56,485 | $3,360 | $53,125 |
| 2014 | $962 | $56,485 | $3,360 | $53,125 |
| 2013 | -- | $56,485 | $3,360 | $53,125 |
Source: Public Records
Map
Nearby Homes