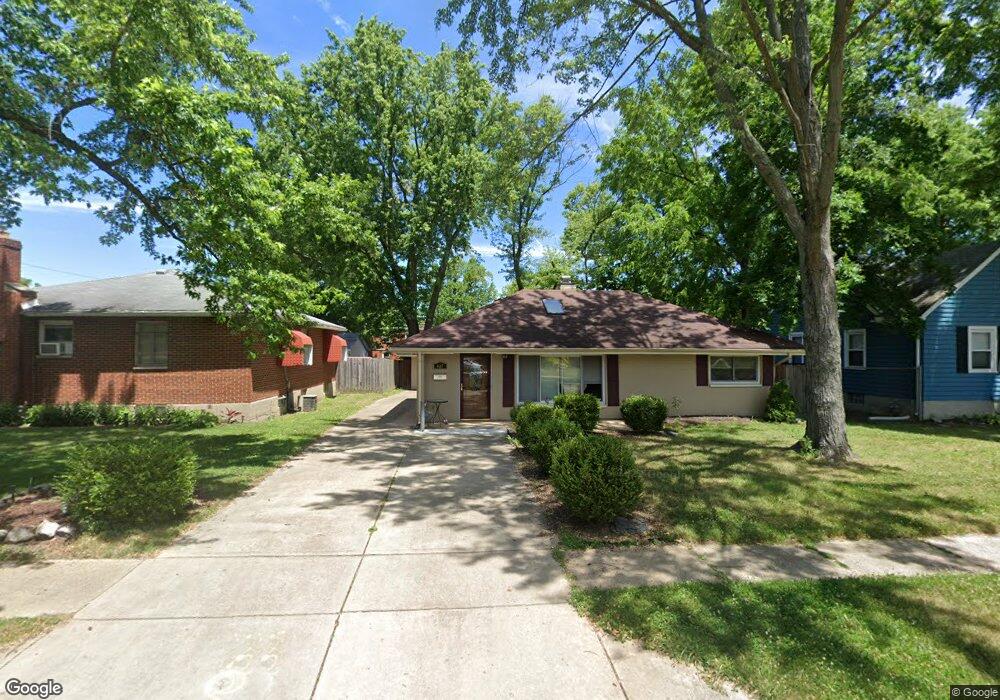
605 Monteray Ave Dayton, OH 45419
Estimated Value: $183,415 - $198,000
2
Beds
1
Bath
1,032
Sq Ft
$186/Sq Ft
Est. Value
About This Home
This home is located at 605 Monteray Ave, Dayton, OH 45419 and is currently estimated at $192,354, approximately $186 per square foot. 605 Monteray Ave is a home located in Montgomery County with nearby schools including Orchard Park Elementary School, Van Buren Middle School, and Kettering Fairmont High School.
Ownership History
Date
Name
Owned For
Owner Type
Purchase Details
Closed on
Mar 8, 2011
Sold by
The Carsyn Ewart Living Trust
Bought by
The Cee Living Trust and Riley Connit L
Current Estimated Value
Purchase Details
Closed on
Jan 31, 2011
Sold by
The Bank Of New York Mellon
Bought by
Ewart Mark Bryan
Purchase Details
Closed on
Jun 25, 2010
Sold by
Deets Jennifer
Bought by
The Bank Of New York Mellon
Purchase Details
Closed on
Dec 23, 2003
Sold by
Weghorst Jennifer and Deets Jennifer
Bought by
Deets Jennifer
Home Financials for this Owner
Home Financials are based on the most recent Mortgage that was taken out on this home.
Original Mortgage
$69,500
Interest Rate
7.99%
Mortgage Type
Purchase Money Mortgage
Purchase Details
Closed on
May 31, 2002
Sold by
Weghorst Jerry
Bought by
Weghorst Jennifer
Purchase Details
Closed on
Jul 31, 1997
Sold by
Howard Johnny L
Bought by
Weghorst Jennifer
Create a Home Valuation Report for This Property
The Home Valuation Report is an in-depth analysis detailing your home's value as well as a comparison with similar homes in the area
Home Values in the Area
Average Home Value in this Area
Purchase History
| Date | Buyer | Sale Price | Title Company |
|---|---|---|---|
| The Cee Living Trust | $37,000 | None Available | |
| Ewart Mark Bryan | $37,000 | Prism Title & Closing Servic | |
| The Bank Of New York Mellon | $62,000 | None Available | |
| Deets Jennifer | -- | -- | |
| Weghorst Jennifer | -- | -- | |
| Weghorst Jennifer | $66,700 | -- |
Source: Public Records
Mortgage History
| Date | Status | Borrower | Loan Amount |
|---|---|---|---|
| Previous Owner | Deets Jennifer | $69,500 |
Source: Public Records
Tax History Compared to Growth
Tax History
| Year | Tax Paid | Tax Assessment Tax Assessment Total Assessment is a certain percentage of the fair market value that is determined by local assessors to be the total taxable value of land and additions on the property. | Land | Improvement |
|---|---|---|---|---|
| 2024 | $2,859 | $45,990 | $12,520 | $33,470 |
| 2023 | $2,859 | $45,990 | $12,520 | $33,470 |
| 2022 | $2,719 | $34,580 | $9,410 | $25,170 |
| 2021 | $2,515 | $34,580 | $9,410 | $25,170 |
| 2020 | $2,524 | $34,580 | $9,410 | $25,170 |
| 2019 | $2,460 | $29,810 | $8,550 | $21,260 |
| 2018 | $2,473 | $29,810 | $8,550 | $21,260 |
| 2017 | $2,278 | $29,810 | $8,550 | $21,260 |
| 2016 | $2,390 | $29,370 | $8,550 | $20,820 |
| 2015 | $2,341 | $29,370 | $8,550 | $20,820 |
| 2014 | $2,341 | $29,370 | $8,550 | $20,820 |
| 2012 | -- | $30,200 | $8,520 | $21,680 |
Source: Public Records
Map
Nearby Homes
- 545 Monteray Ave
- 2004 Shroyer Rd
- 2119 Shroyer Rd
- 538 Wiltshire Blvd
- 1916 Shroyer Rd
- 445 Peach Orchard Ave
- 436 Monteray Ave
- 651 Wiltshire Blvd
- 2701 Aerial Ave
- 1809 Shroyer Rd
- 401 Hadley Ave
- 2601 Oakley Ave
- 355 Hadley Ave
- 2551 Acorn Dr
- 651 Broad Blvd
- 663 Broad Blvd
- 2286 Yorkshire Place
- 1622 Shroyer Rd
- 349 Orchard Dr
- 334 Wiltshire Blvd
- 2510 San Rae Dr
- 615 Monteray Ave
- 623 Monteray Ave
- 610 Hadley Ave
- 551 Monteray Ave
- 600 Hadley Ave Unit 1
- 614 Hadley Ave
- 608 Monteray Ave
- 600 Monteray Ave
- 620 Hadley Ave
- 570 Hadley Ave
- 631 Monteray Ave
- 618 Monteray Ave
- 626 Hadley Ave
- 560 Monteray Ave
- 624 Monteray Ave
- 541 Monteray Ave
- 630 Hadley Ave
- 556 Monteray Ave
- 637 Monteray Ave