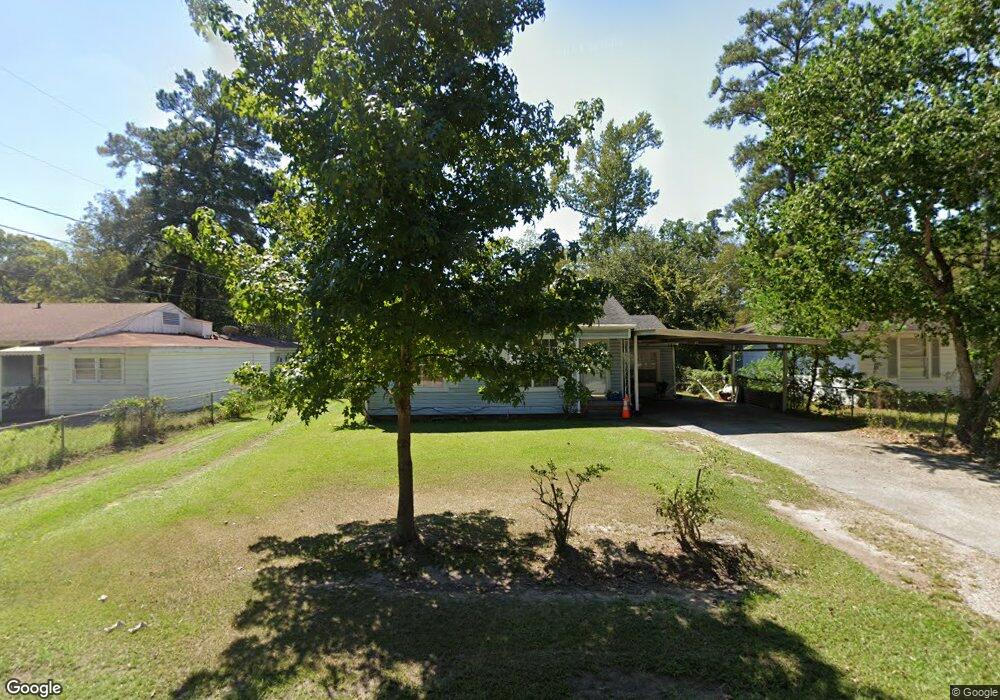
605 Morrow St Lufkin, TX 75904
Estimated Value: $107,000 - $132,000
Studio
5
Baths
1,552
Sq Ft
$80/Sq Ft
Est. Value
About This Home
This home is located at 605 Morrow St, Lufkin, TX 75904 and is currently estimated at $123,979, approximately $79 per square foot. 605 Morrow St is a home located in Angelina County with nearby schools including Trout Primary School, Brookhollow Elementary School, and Lufkin Middle School.
Ownership History
Date
Name
Owned For
Owner Type
Purchase Details
Closed on
Apr 2, 2009
Sold by
Gray Zebby C and Gray Annette
Bought by
Bertrand Delmis C
Current Estimated Value
Home Financials for this Owner
Home Financials are based on the most recent Mortgage that was taken out on this home.
Original Mortgage
$43,610
Outstanding Balance
$11,413
Interest Rate
5.14%
Mortgage Type
Purchase Money Mortgage
Estimated Equity
$112,566
Create a Home Valuation Report for This Property
The Home Valuation Report is an in-depth analysis detailing your home's value as well as a comparison with similar homes in the area
Purchase History
| Date | Buyer | Sale Price | Title Company |
|---|---|---|---|
| Bertrand Delmis C | $43,610 | Community Title |
Source: Public Records
Mortgage History
| Date | Status | Borrower | Loan Amount |
|---|---|---|---|
| Open | Bertrand Delmis C | $43,610 |
Source: Public Records
Tax History
| Year | Tax Paid | Tax Assessment Tax Assessment Total Assessment is a certain percentage of the fair market value that is determined by local assessors to be the total taxable value of land and additions on the property. | Land | Improvement |
|---|---|---|---|---|
| 2025 | $2,061 | $98,630 | $11,680 | $86,950 |
| 2024 | $2,041 | $97,680 | $11,680 | $86,000 |
| 2023 | $1,910 | $96,110 | $11,680 | $84,430 |
| 2022 | $2,036 | $91,710 | $8,270 | $83,440 |
| 2021 | $2,002 | $81,280 | $8,270 | $73,010 |
| 2020 | $1,822 | $74,120 | $8,270 | $65,850 |
| 2019 | $1,927 | $74,120 | $8,270 | $65,850 |
| 2018 | $1,341 | $72,010 | $8,270 | $63,740 |
| 2017 | $1,341 | $68,960 | $8,270 | $60,690 |
| 2016 | $1,607 | $67,400 | $8,270 | $59,130 |
| 2015 | $1,288 | $67,400 | $8,270 | $59,130 |
| 2014 | $1,288 | $65,440 | $8,270 | $57,170 |
Source: Public Records
Map
Nearby Homes
- 603 Morrow Ave
- 417 Vine Dr
- 1008 Tom Temple Dr
- 909 Covington Dr
- 1202 Mimosa St
- 715 Pine Tree Ln
- 1207 Southwood Dr
- 404 Dogwood Trail
- 907 Southwood Dr
- 304 Lee Ln
- 521 Feagin Dr
- 328 Sunset Blvd
- 802 Wildbriar Dr
- 230 Stoney Ridge
- 1308 Southwood Dr
- 1435 Feagin Dr
- 421 House St
- 1370 Evans-Gann Rd
- 910 Russell Ave
- 900 Wildbriar Dr
Your Personal Tour Guide
Ask me questions while you tour the home.