Estimated Value: $301,000 - $324,000
4
Beds
2
Baths
3,084
Sq Ft
$101/Sq Ft
Est. Value
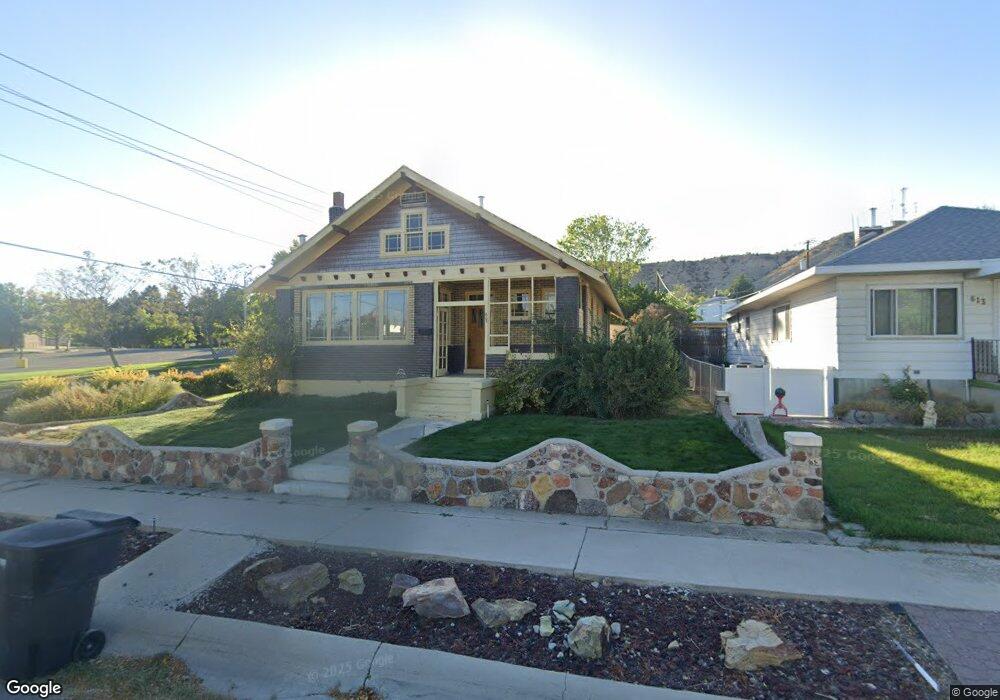
About This Home
This home is located at 605 N 200 E, Price, UT 84501 and is currently estimated at $312,430, approximately $101 per square foot. 605 N 200 E is a home located in Carbon County with nearby schools including Castle Heights School, Mont Harmon Junior High School, and Carbon High School.
Ownership History
Date
Name
Owned For
Owner Type
Purchase Details
Closed on
Oct 3, 2024
Sold by
Austin Ruby Lee and Morgan Harold
Bought by
Traster Kevin and Lee Mee Sun
Current Estimated Value
Home Financials for this Owner
Home Financials are based on the most recent Mortgage that was taken out on this home.
Original Mortgage
$282,258
Outstanding Balance
$278,805
Interest Rate
6.46%
Mortgage Type
New Conventional
Estimated Equity
$33,625
Purchase Details
Closed on
Dec 27, 2023
Sold by
Morgan Harold
Bought by
Morgan Harold and Austin Ruby Lee
Purchase Details
Closed on
May 23, 2016
Sold by
Morgan Harold and Morgan Peggy Pauline
Bought by
Morgan Harold
Home Financials for this Owner
Home Financials are based on the most recent Mortgage that was taken out on this home.
Original Mortgage
$68,500
Interest Rate
3.58%
Mortgage Type
New Conventional
Purchase Details
Closed on
Mar 8, 2012
Sold by
Morgan Harold
Bought by
Morgan Harold and Morgan Peggy Pauline
Create a Home Valuation Report for This Property
The Home Valuation Report is an in-depth analysis detailing your home's value as well as a comparison with similar homes in the area
Purchase History
| Date | Buyer | Sale Price | Title Company |
|---|---|---|---|
| Traster Kevin | -- | Professional Title Services | |
| Morgan Harold | -- | Carbon County Corporation | |
| Morgan Harold | -- | Professional Title Services | |
| Morgan Harold | -- | -- |
Source: Public Records
Mortgage History
| Date | Status | Borrower | Loan Amount |
|---|---|---|---|
| Open | Traster Kevin | $282,258 | |
| Previous Owner | Morgan Harold | $68,500 |
Source: Public Records
Tax History
| Year | Tax Paid | Tax Assessment Tax Assessment Total Assessment is a certain percentage of the fair market value that is determined by local assessors to be the total taxable value of land and additions on the property. | Land | Improvement |
|---|---|---|---|---|
| 2025 | $1,335 | $109,900 | $11,590 | $98,310 |
| 2024 | $2,117 | $176,282 | $11,550 | $164,732 |
| 2023 | $1,623 | $144,069 | $12,647 | $131,422 |
| 2022 | $1,696 | $135,080 | $10,514 | $124,566 |
| 2021 | $1,457 | $180,183 | $16,065 | $164,118 |
| 2020 | $1,430 | $88,700 | $0 | $0 |
| 2019 | $1,272 | $82,741 | $0 | $0 |
| 2018 | $1,212 | $80,444 | $0 | $0 |
| 2017 | $1,197 | $80,444 | $0 | $0 |
| 2016 | $1,080 | $80,444 | $0 | $0 |
| 2015 | $1,080 | $80,444 | $0 | $0 |
| 2014 | $1,073 | $80,444 | $0 | $0 |
| 2013 | $1,160 | $86,184 | $0 | $0 |
Source: Public Records
Map
Nearby Homes
Your Personal Tour Guide
Ask me questions while you tour the home.