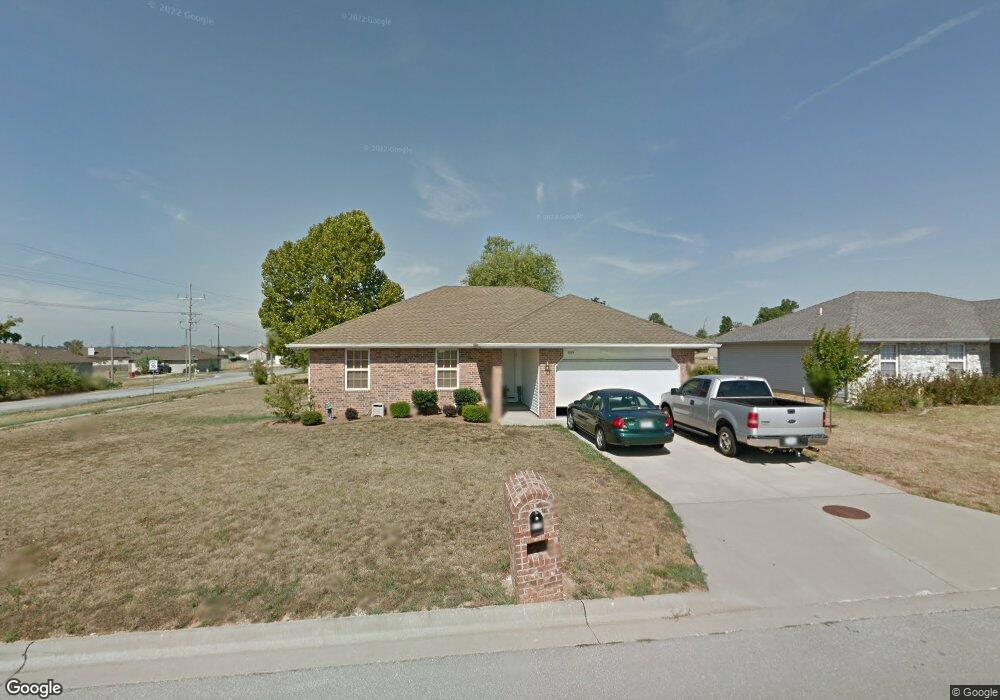
605 N Franklin Ave Republic, MO 65738
Estimated Value: $229,000 - $253,000
3
Beds
2
Baths
1,322
Sq Ft
$183/Sq Ft
Est. Value
About This Home
This home is located at 605 N Franklin Ave, Republic, MO 65738 and is currently estimated at $241,357, approximately $182 per square foot. 605 N Franklin Ave is a home located in Greene County with nearby schools including Price Elementary School, Republic Middle School, and Republic High School.
Ownership History
Date
Name
Owned For
Owner Type
Purchase Details
Closed on
Nov 18, 2011
Sold by
Secretary Of Hud
Bought by
Shepherd Herman Preston and Shepherd Linda Darlene
Current Estimated Value
Purchase Details
Closed on
Aug 2, 2011
Sold by
Gmac Mortgage Llc
Bought by
Secretary Of Hud
Purchase Details
Closed on
Jul 28, 2011
Sold by
Macey Steve and Macey Veronica E
Bought by
Gmac Mortgage Llc
Purchase Details
Closed on
Feb 16, 2007
Sold by
Morelock Family Limited Partnership
Bought by
Macey Steve and Macey Veronica E
Home Financials for this Owner
Home Financials are based on the most recent Mortgage that was taken out on this home.
Original Mortgage
$121,900
Interest Rate
6.17%
Mortgage Type
Purchase Money Mortgage
Purchase Details
Closed on
Aug 24, 2006
Sold by
Morelock Ross Properties Inc
Bought by
Morelock Family Lp
Purchase Details
Closed on
Aug 23, 2006
Sold by
Bebout Willie S
Bought by
Whw Investments Inc
Create a Home Valuation Report for This Property
The Home Valuation Report is an in-depth analysis detailing your home's value as well as a comparison with similar homes in the area
Home Values in the Area
Average Home Value in this Area
Purchase History
| Date | Buyer | Sale Price | Title Company |
|---|---|---|---|
| Shepherd Herman Preston | -- | None Available | |
| Secretary Of Hud | -- | Continental Title | |
| Gmac Mortgage Llc | $132,952 | None Available | |
| Macey Steve | -- | None Available | |
| Morelock Family Lp | -- | None Available | |
| Whw Investments Inc | -- | None Available |
Source: Public Records
Mortgage History
| Date | Status | Borrower | Loan Amount |
|---|---|---|---|
| Previous Owner | Macey Steve | $121,900 |
Source: Public Records
Tax History Compared to Growth
Tax History
| Year | Tax Paid | Tax Assessment Tax Assessment Total Assessment is a certain percentage of the fair market value that is determined by local assessors to be the total taxable value of land and additions on the property. | Land | Improvement |
|---|---|---|---|---|
| 2025 | $1,580 | $31,410 | $5,700 | $25,710 |
| 2024 | $1,580 | $28,290 | $4,750 | $23,540 |
| 2023 | $1,550 | $28,290 | $4,750 | $23,540 |
| 2022 | $1,374 | $24,950 | $4,750 | $20,200 |
| 2021 | $1,365 | $24,950 | $4,750 | $20,200 |
| 2020 | $1,286 | $23,140 | $4,750 | $18,390 |
| 2019 | $1,282 | $23,140 | $4,750 | $18,390 |
| 2018 | $1,179 | $20,560 | $3,800 | $16,760 |
| 2017 | $1,169 | $19,670 | $3,800 | $15,870 |
| 2016 | $1,131 | $19,670 | $3,800 | $15,870 |
| 2015 | $1,127 | $19,670 | $3,800 | $15,870 |
| 2014 | $1,086 | $18,790 | $3,800 | $14,990 |
Source: Public Records
Map
Nearby Homes
- 715 N Franklin Ave
- 733 N Franklin Ave
- 761 N Lexington Ave
- 508 Glenwood Ave
- 515 N Glenwood Ave
- 747 N Glenwood Ave
- 7217 W Farm Road 182
- 0 W Farm Road 174 Unit 60286557
- 435 N Claremont Place
- 4889 S Douglas Dr
- 436 N Murphy Dr
- 2465 E Timber Oak St
- 1226 N London Place
- 1265 N Willow Cir
- 3071 E Franz Sigel St
- Lot 24 The Woods
- 3014 E Heritage St
- 1550KP-4 Plan at Greenfield Estates
- 1350 Plan at Greenfield Estates
- 1400 Plan at Greenfield Estates
- 621 N Franklin Ave
- 3152 E Jamestown St
- 6868 W Farm Rd 178
- 635 N Franklin Ave
- 3166 E Jamestown St
- 3191 E Hines St
- 3151 E Jamestown St
- 598 N Texas Ave
- 598 Texas
- 653 N Franklin Ave
- 3172 E Jamestown St
- 3167 E Jamestown St
- 664 N Delaware Ave
- 3250 E Hines St
- 586 Texas
- 667 N Franklin Ave
- 3179 E Jamestown St
- 3184 E Jamestown St
- 574 N Texas Ave
- 574 Texas