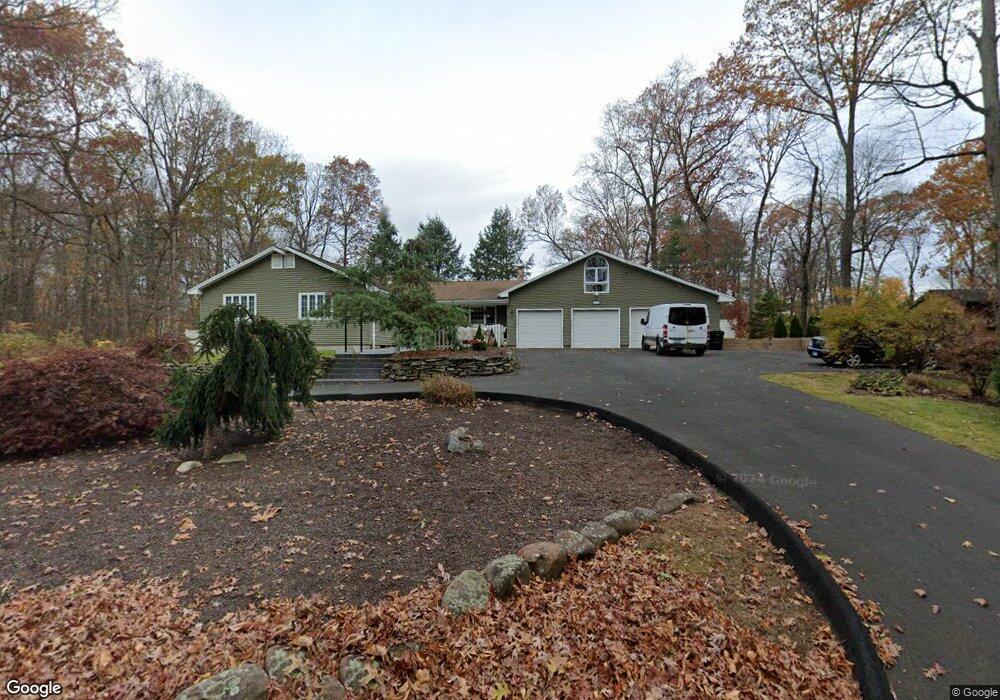
605 Nevers Rd South Windsor, CT 06074
Estimated Value: $543,032 - $618,000
3
Beds
2
Baths
2,376
Sq Ft
$245/Sq Ft
Est. Value
About This Home
This home is located at 605 Nevers Rd, South Windsor, CT 06074 and is currently estimated at $583,258, approximately $245 per square foot. 605 Nevers Rd is a home located in Hartford County with nearby schools including Timothy Edwards School and South Windsor High School.
Ownership History
Date
Name
Owned For
Owner Type
Purchase Details
Closed on
Jun 6, 2007
Sold by
Hauck Roy and Hauck Cheryl
Bought by
Quirion Joel and Quirion Anne
Current Estimated Value
Home Financials for this Owner
Home Financials are based on the most recent Mortgage that was taken out on this home.
Original Mortgage
$207,900
Interest Rate
6.17%
Purchase Details
Closed on
May 12, 2006
Sold by
Carter Richard and Carter Emily
Bought by
Hauck Roy and Hauck Cheryl
Purchase Details
Closed on
May 26, 2000
Sold by
Patria Jean K
Bought by
Carter Richard and Carter Emily
Purchase Details
Closed on
Dec 12, 1988
Sold by
Vieira Carmela
Bought by
Sepulveda Eunice
Create a Home Valuation Report for This Property
The Home Valuation Report is an in-depth analysis detailing your home's value as well as a comparison with similar homes in the area
Home Values in the Area
Average Home Value in this Area
Purchase History
| Date | Buyer | Sale Price | Title Company |
|---|---|---|---|
| Quirion Joel | $369,900 | -- | |
| Hauck Roy | $375,000 | -- | |
| Carter Richard | $214,000 | -- | |
| Sepulveda Eunice | $215,000 | -- |
Source: Public Records
Mortgage History
| Date | Status | Borrower | Loan Amount |
|---|---|---|---|
| Closed | Sepulveda Eunice | $150,000 | |
| Closed | Sepulveda Eunice | $207,900 |
Source: Public Records
Tax History
| Year | Tax Paid | Tax Assessment Tax Assessment Total Assessment is a certain percentage of the fair market value that is determined by local assessors to be the total taxable value of land and additions on the property. | Land | Improvement |
|---|---|---|---|---|
| 2025 | $10,843 | $304,500 | $95,300 | $209,200 |
| 2024 | $10,493 | $304,500 | $95,300 | $209,200 |
| 2023 | $10,091 | $304,500 | $95,300 | $209,200 |
| 2022 | $7,770 | $200,400 | $88,300 | $112,100 |
| 2021 | $7,587 | $200,400 | $88,300 | $112,100 |
| 2020 | $7,591 | $200,400 | $88,300 | $112,100 |
| 2019 | $7,715 | $200,400 | $88,300 | $112,100 |
| 2018 | $7,549 | $200,400 | $88,300 | $112,100 |
| 2017 | $7,418 | $194,800 | $88,300 | $106,500 |
| 2016 | $7,274 | $194,800 | $88,300 | $106,500 |
| 2015 | $7,118 | $194,800 | $88,300 | $106,500 |
| 2014 | -- | $194,800 | $88,300 | $106,500 |
Source: Public Records
Map
Nearby Homes
- 555 Graham Rd
- 64 Garnet Ln
- 33 Ash Rd
- 79 Steep Rd
- 814 Graham Rd
- 4 Steep Rd
- 76 Griffin Rd
- 668 Sullivan Ave
- 10 Devonshire Dr
- 1106 Summer Hill Dr
- 1503 Summer Hill Dr
- 16 Foxglove Ln Unit 16
- 610 Niederwerfer Rd
- 40 Barber Hill Rd
- 11 Mara Trail
- 49 Deepwood Dr
- 35 Vincent Cir
- 74 Wapping Wood Rd
- 57 Hayes Ave
- 59 Wapping Wood Rd
Your Personal Tour Guide
Ask me questions while you tour the home.