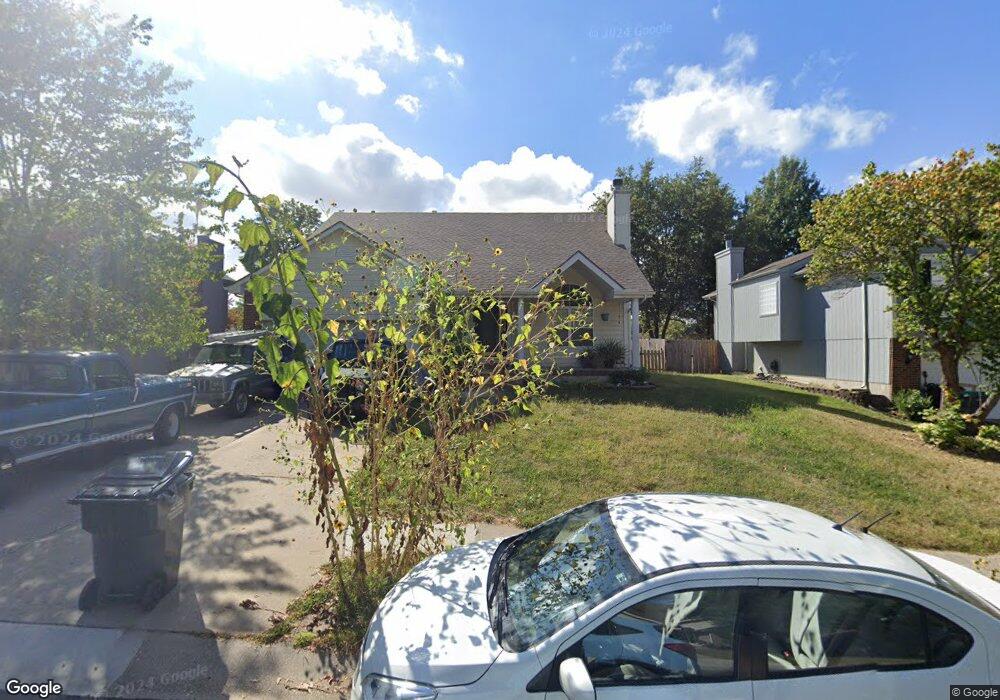
605 NW Cortland Dr Blue Springs, MO 64015
Estimated Value: $318,000 - $330,702
4
Beds
3
Baths
1,232
Sq Ft
$263/Sq Ft
Est. Value
About This Home
This home is located at 605 NW Cortland Dr, Blue Springs, MO 64015 and is currently estimated at $324,426, approximately $263 per square foot. 605 NW Cortland Dr is a home located in Jackson County with nearby schools including John Nowlin Elementary School, Paul Kinder Middle School, and Blue Springs High School.
Ownership History
Date
Name
Owned For
Owner Type
Purchase Details
Closed on
Jan 10, 2014
Sold by
Gibson Scotty C and Gibson Scotty C
Bought by
Gibson Scotty C
Current Estimated Value
Home Financials for this Owner
Home Financials are based on the most recent Mortgage that was taken out on this home.
Original Mortgage
$156,800
Outstanding Balance
$118,828
Interest Rate
4.49%
Mortgage Type
VA
Estimated Equity
$205,598
Purchase Details
Closed on
Oct 13, 2005
Sold by
Deischer Dennis R
Bought by
Gibson Scotty C and Redmon Mary
Home Financials for this Owner
Home Financials are based on the most recent Mortgage that was taken out on this home.
Original Mortgage
$173,438
Interest Rate
5.73%
Mortgage Type
FHA
Purchase Details
Closed on
Dec 22, 1997
Sold by
T E Woods Construction Inc
Bought by
Deischer Dennis R
Home Financials for this Owner
Home Financials are based on the most recent Mortgage that was taken out on this home.
Original Mortgage
$121,050
Interest Rate
7.22%
Mortgage Type
Purchase Money Mortgage
Create a Home Valuation Report for This Property
The Home Valuation Report is an in-depth analysis detailing your home's value as well as a comparison with similar homes in the area
Home Values in the Area
Average Home Value in this Area
Purchase History
| Date | Buyer | Sale Price | Title Company |
|---|---|---|---|
| Gibson Scotty C | -- | None Available | |
| Gibson Scotty C | -- | Stewart Title Of Kansas City | |
| Deischer Dennis R | -- | -- |
Source: Public Records
Mortgage History
| Date | Status | Borrower | Loan Amount |
|---|---|---|---|
| Open | Gibson Scotty C | $156,800 | |
| Closed | Gibson Scotty C | $173,438 | |
| Previous Owner | Deischer Dennis R | $121,050 |
Source: Public Records
Tax History Compared to Growth
Tax History
| Year | Tax Paid | Tax Assessment Tax Assessment Total Assessment is a certain percentage of the fair market value that is determined by local assessors to be the total taxable value of land and additions on the property. | Land | Improvement |
|---|---|---|---|---|
| 2025 | $4,058 | $57,200 | $7,078 | $50,122 |
| 2024 | $3,980 | $49,740 | $6,922 | $42,818 |
| 2023 | $3,980 | $49,741 | $5,461 | $44,280 |
| 2022 | $4,025 | $44,460 | $4,636 | $39,824 |
| 2021 | $4,022 | $44,460 | $4,636 | $39,824 |
| 2020 | $3,453 | $38,834 | $4,636 | $34,198 |
| 2019 | $3,339 | $38,834 | $4,636 | $34,198 |
| 2018 | $3,001 | $33,603 | $3,746 | $29,857 |
| 2017 | $3,115 | $33,603 | $3,746 | $29,857 |
| 2016 | $3,115 | $31,217 | $4,199 | $27,018 |
| 2014 | $2,669 | $29,868 | $4,200 | $25,668 |
Source: Public Records
Map
Nearby Homes
- 4301 NW Briarwood Dr
- 4508 NW Valley View Rd
- 14 Emerald Shore Dr
- 4012 NW Delwood Ct
- 704 NW 39th St
- 0 No Address Assigned By County N A Unit HMS2492165
- 4075 SW M 7 Hwy
- 3605 NW Dogwood Dr
- 3616 NW Dogwood Dr
- 5200 NW Primrose Ct
- 1401 NW Birdseye Ct
- 5205 NW Primrose Ct
- 1204 NW 55th St
- 404 Countryside Rd
- 403 Countryside Rd
- 405 Bellemere Rd
- 1515 NW Primrose Ln
- 3213 NW Canterbury Place
- 3212 NW Canterbury Rd
- 27 Beach Dr
- 603 NW Cortland Dr
- 609 NW Cortland Dr
- 601 NW Cortland Dr
- 604 NW Cortland Dr
- 606 NW Cortland Dr
- 717 NW Rosaceae Dr
- 602 NW Cortland Dr
- 608 NW Cortland Dr
- 719 NW Rosaceae Dr
- 600 NW Cortland Dr
- 610 NW Cortland Dr
- 721 NW Rosaceae Dr
- 808 NW Blossom Ct
- 804 NW Blossom Ct
- 610R NW Cortland Dr
- 4309 NW Cortland St
- 715 NW Rosaceae Dr
- 4313 NW Cortland St
- 4321 NW Cortland St
- 800 NW Blossom Ct