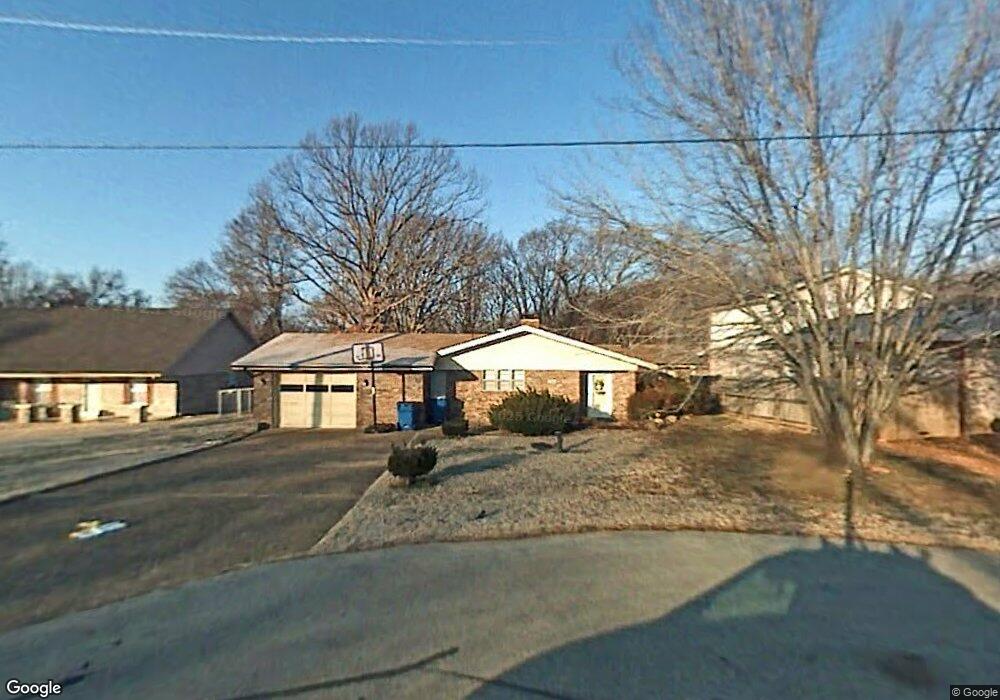
605 NW K St Bentonville, AR 72712
Estimated Value: $404,000 - $504,525
3
Beds
2
Baths
1,800
Sq Ft
$255/Sq Ft
Est. Value
About This Home
This home is located at 605 NW K St, Bentonville, AR 72712 and is currently estimated at $458,881, approximately $254 per square foot. 605 NW K St is a home located in Benton County with nearby schools including Thomas Jefferson Elementary School, Lincoln Junior High School, and Ardis Ann Middle School.
Ownership History
Date
Name
Owned For
Owner Type
Purchase Details
Closed on
Dec 20, 2004
Bought by
Clark
Current Estimated Value
Purchase Details
Closed on
Oct 17, 2001
Bought by
Clark
Purchase Details
Closed on
Jul 25, 2001
Bought by
Dod 07-25-2001
Purchase Details
Closed on
Dec 6, 2000
Bought by
Adamson Tr
Purchase Details
Closed on
Dec 5, 2000
Bought by
Adamson Rev Trust
Purchase Details
Closed on
Aug 17, 1998
Bought by
Dod 08-17-1998
Purchase Details
Closed on
Feb 22, 1977
Bought by
Adamson
Purchase Details
Closed on
May 23, 1974
Bought by
Mashburn
Create a Home Valuation Report for This Property
The Home Valuation Report is an in-depth analysis detailing your home's value as well as a comparison with similar homes in the area
Home Values in the Area
Average Home Value in this Area
Purchase History
| Date | Buyer | Sale Price | Title Company |
|---|---|---|---|
| Clark | -- | -- | |
| Clark | -- | -- | |
| Clark | -- | -- | |
| Dod 07-25-2001 | -- | -- | |
| Adamson Tr | -- | -- | |
| Adamson | -- | -- | |
| Adamson Rev Trust | -- | -- | |
| Dod 08-17-1998 | -- | -- | |
| Adamson | $38,000 | -- | |
| Mashburn | $38,000 | -- |
Source: Public Records
Tax History Compared to Growth
Tax History
| Year | Tax Paid | Tax Assessment Tax Assessment Total Assessment is a certain percentage of the fair market value that is determined by local assessors to be the total taxable value of land and additions on the property. | Land | Improvement |
|---|---|---|---|---|
| 2025 | $2,940 | $75,245 | $15,000 | $60,245 |
| 2024 | $2,707 | $75,245 | $15,000 | $60,245 |
| 2023 | $2,461 | $46,720 | $8,600 | $38,120 |
| 2022 | $2,328 | $46,720 | $8,600 | $38,120 |
| 2021 | $2,127 | $46,720 | $8,600 | $38,120 |
| 2020 | $1,952 | $31,500 | $3,800 | $27,700 |
| 2019 | $1,822 | $31,500 | $3,800 | $27,700 |
| 2018 | $1,693 | $31,500 | $3,800 | $27,700 |
| 2017 | $1,388 | $31,500 | $3,800 | $27,700 |
| 2016 | $1,388 | $31,500 | $3,800 | $27,700 |
| 2015 | $1,264 | $20,450 | $2,800 | $17,650 |
| 2014 | $1,264 | $20,450 | $2,800 | $17,650 |
Source: Public Records
Map
Nearby Homes