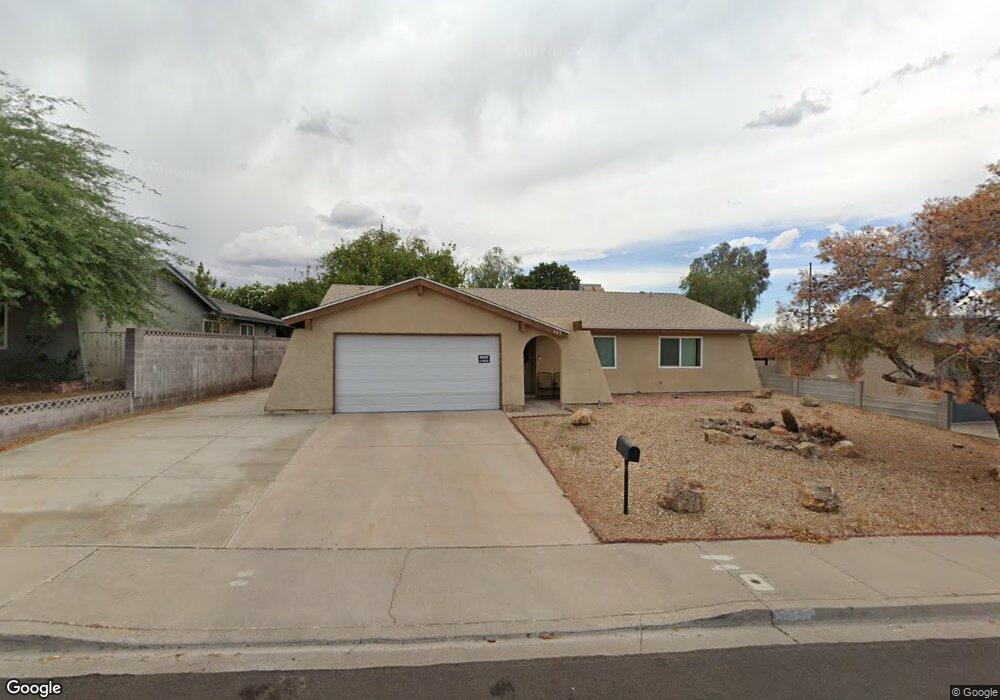
605 Overland Dr Henderson, NV 89002
Highland Hills NeighborhoodEstimated Value: $321,000 - $387,000
3
Beds
2
Baths
1,430
Sq Ft
$258/Sq Ft
Est. Value
About This Home
This home is located at 605 Overland Dr, Henderson, NV 89002 and is currently estimated at $369,220, approximately $258 per square foot. 605 Overland Dr is a home located in Clark County with nearby schools including Fay Galloway Elementary School, Jack & Terry Mannion Middle School, and Foothill High School.
Ownership History
Date
Name
Owned For
Owner Type
Purchase Details
Closed on
Nov 22, 2024
Sold by
Maydock Brina M
Bought by
Brina Maydock Family Trust
Current Estimated Value
Purchase Details
Closed on
Dec 20, 2022
Sold by
Maydock James A
Bought by
Maydock James A and Maydock Brina M
Purchase Details
Closed on
Jun 11, 2010
Sold by
Girard Lawrence
Bought by
Maydock James A and Maydock Brenda J
Purchase Details
Closed on
Aug 5, 2009
Sold by
Us Bank National Association
Bought by
Girard Lawrence
Purchase Details
Closed on
May 1, 2009
Sold by
Hamilton Gregory M and Hamilton Carla J
Bought by
Us Bank National Association and Residential Funding Company Llc
Purchase Details
Closed on
Nov 14, 2005
Sold by
Thompson Bette Jane
Bought by
Hamilton Gregory M and Hamilton Carla J
Home Financials for this Owner
Home Financials are based on the most recent Mortgage that was taken out on this home.
Original Mortgage
$214,400
Interest Rate
6.55%
Mortgage Type
Unknown
Create a Home Valuation Report for This Property
The Home Valuation Report is an in-depth analysis detailing your home's value as well as a comparison with similar homes in the area
Home Values in the Area
Average Home Value in this Area
Purchase History
| Date | Buyer | Sale Price | Title Company |
|---|---|---|---|
| Brina Maydock Family Trust | -- | None Listed On Document | |
| Maydock James A | -- | I Title | |
| Maydock Brina M | $160,883 | I Title | |
| Maydock James A | $80,000 | Noble Title | |
| Girard Lawrence | $71,000 | Ticor Title Las Vegas | |
| Us Bank National Association | $102,000 | None Available | |
| Hamilton Gregory M | $268,000 | Land Title Of Nevada |
Source: Public Records
Mortgage History
| Date | Status | Borrower | Loan Amount |
|---|---|---|---|
| Previous Owner | Hamilton Gregory M | $214,400 |
Source: Public Records
Tax History Compared to Growth
Tax History
| Year | Tax Paid | Tax Assessment Tax Assessment Total Assessment is a certain percentage of the fair market value that is determined by local assessors to be the total taxable value of land and additions on the property. | Land | Improvement |
|---|---|---|---|---|
| 2025 | $1,121 | $50,798 | $28,700 | $22,098 |
| 2024 | $1,089 | $50,798 | $28,700 | $22,098 |
| 2023 | $1,141 | $56,309 | $33,950 | $22,359 |
| 2022 | $1,057 | $48,343 | $27,300 | $21,043 |
| 2021 | $979 | $46,142 | $25,550 | $20,592 |
| 2020 | $906 | $45,828 | $24,850 | $20,978 |
| 2019 | $849 | $42,169 | $21,000 | $21,169 |
| 2018 | $810 | $39,699 | $18,900 | $20,799 |
| 2017 | $1,141 | $39,374 | $17,850 | $21,524 |
| 2016 | $760 | $32,905 | $10,500 | $22,405 |
| 2015 | $757 | $33,041 | $10,500 | $22,541 |
| 2014 | $734 | $25,667 | $8,750 | $16,917 |
Source: Public Records
Map
Nearby Homes
- 615 Hidden Valley Dr
- 234 Walsh Peak Ave
- 302 Walsh Peak Ave
- 334 Laurel Peak Dr
- 331 Laurel Peak Dr
- 408 Scenic Dr
- 317 Mount Williamson St
- 328 Owens Peak Dr
- 316 Mount Williamson St
- 313 Mount Langley St
- Rhett Plan at Highpointe at Black Mt Ranch
- Franklin with Next Gen Suite Plan at Highpointe at Black Mt Ranch
- Reid Plan at Highpointe at Black Mt Ranch
- Ramsey Plan at Highpointe at Black Mt Ranch
- Fletcher Plan at Highpointe at Black Mt Ranch
- Finley Plan at Highpointe at Black Mt Ranch
- 242 White Crest Peak Ave
- Nora Plan at Landmark at Black Mt Ranch
- Diana Plan at Landmark at Black Mt Ranch
- Elliot Plan at Landmark at Black Mt Ranch
- 607 Overland Dr
- 603 Overland Dr
- 605 Sierra Ln
- 609 Overland Dr
- 601 Overland Dr
- 604 Overland Dr
- 606 Overland Dr
- 602 Overland Dr
- 608 Overland Dr
- 432 E Horizon Dr Unit 28
- 611 Overland Dr
- 600 Overland Dr
- 610 Overland Dr
- 609 Sierra Ln
- 611 Winchester Dr
- 609 Winchester Dr
- 417 Emerald Cir
- 613 Winchester Dr
- 613 Overland Dr
- 418 E Horizon Dr