Estimated Value: $286,928 - $389,000
3
Beds
2
Baths
1,480
Sq Ft
$218/Sq Ft
Est. Value
About This Home
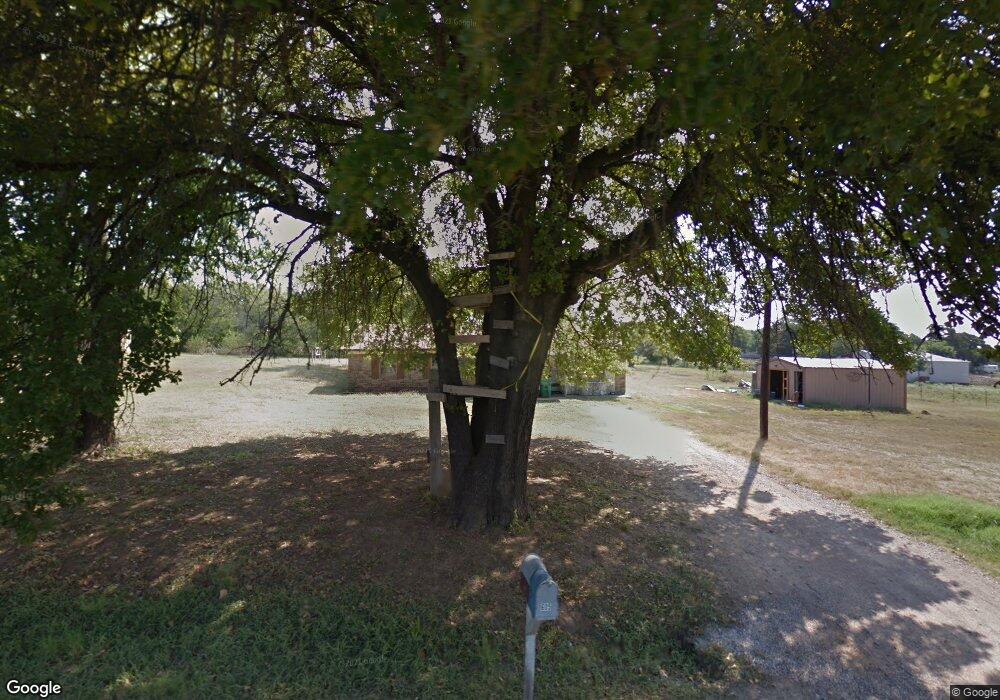
This home is located at 605 Parker St, Azle, TX 76020 and is currently estimated at $322,982, approximately $218 per square foot. 605 Parker St is a home located in Parker County with nearby schools including Springtown Reno Elementary School, Springtown Intermediate School, and Springtown Middle School.
Ownership History
Date
Name
Owned For
Owner Type
Purchase Details
Closed on
May 23, 2016
Sold by
Trimber Cameron
Bought by
Barron Felix
Current Estimated Value
Home Financials for this Owner
Home Financials are based on the most recent Mortgage that was taken out on this home.
Original Mortgage
$126,663
Outstanding Balance
$101,127
Interest Rate
3.75%
Mortgage Type
FHA
Estimated Equity
$221,855
Purchase Details
Closed on
Dec 3, 2015
Sold by
Hsbc Bank Usa National Association
Bought by
Barron Felix
Purchase Details
Closed on
Nov 30, 2015
Bought by
Barron Felix
Purchase Details
Closed on
May 6, 2015
Sold by
White Wanetta Rae
Bought by
Barron Felix
Purchase Details
Closed on
Oct 29, 2004
Sold by
Farquhar Johathan and Farquhar Lisa
Bought by
Barron Felix
Purchase Details
Closed on
Feb 11, 2000
Sold by
Roberts Charles Michael
Bought by
Barron Felix
Purchase Details
Closed on
Sep 4, 1986
Sold by
Wood Weldon and Wood Tinie
Bought by
Barron Felix
Create a Home Valuation Report for This Property
The Home Valuation Report is an in-depth analysis detailing your home's value as well as a comparison with similar homes in the area
Home Values in the Area
Average Home Value in this Area
Purchase History
| Date | Buyer | Sale Price | Title Company |
|---|---|---|---|
| Barron Felix | -- | Attorney | |
| Barron Felix | -- | -- | |
| Trimber Cameron | -- | None Available | |
| Barron Felix | -- | -- | |
| Barron Felix | -- | -- | |
| Hsbc Bank Usa National Association | $102,500 | None Available | |
| Barron Felix | -- | -- | |
| Barron Felix | -- | -- | |
| Barron Felix | -- | -- |
Source: Public Records
Mortgage History
| Date | Status | Borrower | Loan Amount |
|---|---|---|---|
| Open | Barron Felix | $126,663 |
Source: Public Records
Tax History
| Year | Tax Paid | Tax Assessment Tax Assessment Total Assessment is a certain percentage of the fair market value that is determined by local assessors to be the total taxable value of land and additions on the property. | Land | Improvement |
|---|---|---|---|---|
| 2025 | $3,936 | $425,150 | $80,000 | $345,150 |
| 2024 | $3,936 | $271,360 | $80,000 | $191,360 |
| 2023 | $3,936 | $271,360 | $80,000 | $191,360 |
| 2022 | $4,282 | $199,040 | $50,000 | $149,040 |
| 2021 | $4,689 | $199,040 | $50,000 | $149,040 |
| 2020 | $3,865 | $164,520 | $40,000 | $124,520 |
| 2019 | $4,103 | $164,520 | $40,000 | $124,520 |
Source: Public Records
Map
Nearby Homes
- 445 Arvel Cir
- 1060 E Reno Rd
- 110 Tiffany Ct
- 1170 Arvel Cir Unit C
- 1170 Arvel Cir Unit B
- 1170 Arvel Cir Unit A
- 934 Tiffany St
- TBD W Browder Cir
- 109 Pleasant Run
- 610 S Cardinal Rd
- 161 E Reno Rd
- 945 Walnut St
- 1012 Katie Ct
- 1620 W Timberlake St Unit E
- 1620 W Timberlake St Unit A-E
- 1620 W Timberlake St Unit D
- 1620 W Timberlake St Unit B
- 1620 W Timberlake St Unit C
- 1620 W Timberlake St Unit A
- TBD Nelson Rd
Your Personal Tour Guide
Ask me questions while you tour the home.