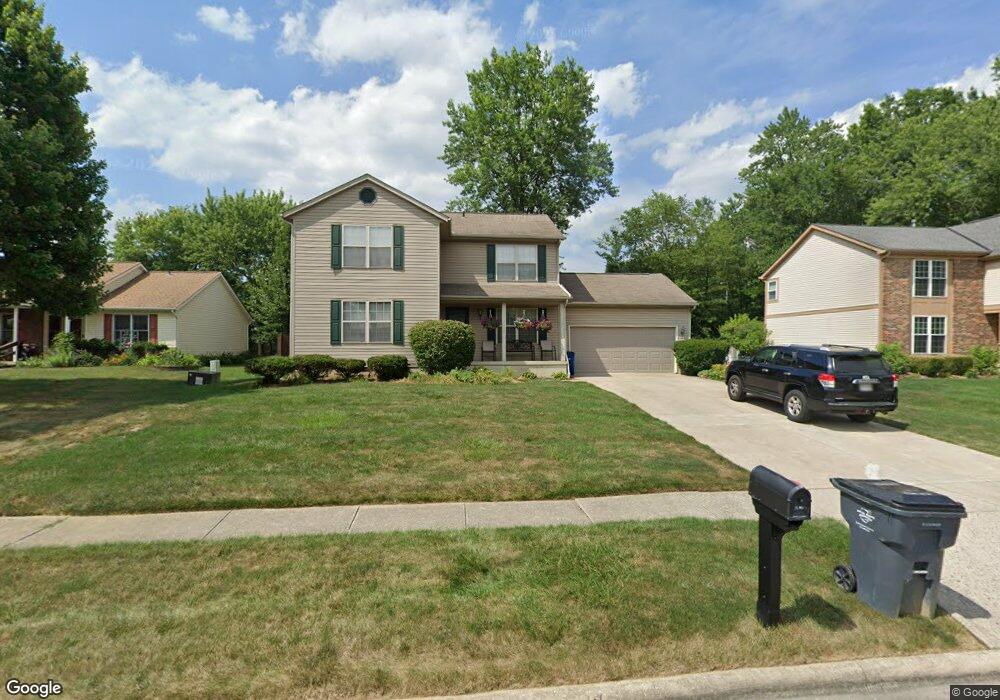
605 Ridenour Rd Columbus, OH 43230
Estimated Value: $418,000 - $469,000
3
Beds
3
Baths
1,986
Sq Ft
$223/Sq Ft
Est. Value
About This Home
This home is located at 605 Ridenour Rd, Columbus, OH 43230 and is currently estimated at $442,567, approximately $222 per square foot. 605 Ridenour Rd is a home located in Franklin County with nearby schools including Chapelfield Elementary School, Gahanna West Middle School, and Lincoln High School.
Ownership History
Date
Name
Owned For
Owner Type
Purchase Details
Closed on
Jun 30, 1999
Sold by
Fox Glen F and Fox Peggy A
Bought by
Oglesbee William H and Oglesbee Gloria
Current Estimated Value
Home Financials for this Owner
Home Financials are based on the most recent Mortgage that was taken out on this home.
Original Mortgage
$153,600
Outstanding Balance
$42,074
Interest Rate
7.28%
Mortgage Type
FHA
Estimated Equity
$400,493
Purchase Details
Closed on
Aug 14, 1996
Sold by
Baker Amy J
Bought by
Fox Glen E and Fox Peggy A
Home Financials for this Owner
Home Financials are based on the most recent Mortgage that was taken out on this home.
Original Mortgage
$123,500
Interest Rate
8.18%
Mortgage Type
New Conventional
Purchase Details
Closed on
Mar 3, 1993
Purchase Details
Closed on
Feb 19, 1992
Create a Home Valuation Report for This Property
The Home Valuation Report is an in-depth analysis detailing your home's value as well as a comparison with similar homes in the area
Home Values in the Area
Average Home Value in this Area
Purchase History
| Date | Buyer | Sale Price | Title Company |
|---|---|---|---|
| Oglesbee William H | $155,000 | Chicago Title West | |
| Fox Glen E | $133,000 | -- | |
| -- | $122,000 | -- | |
| -- | $372,000 | -- |
Source: Public Records
Mortgage History
| Date | Status | Borrower | Loan Amount |
|---|---|---|---|
| Open | Oglesbee William H | $153,600 | |
| Closed | Fox Glen E | $123,500 |
Source: Public Records
Tax History Compared to Growth
Tax History
| Year | Tax Paid | Tax Assessment Tax Assessment Total Assessment is a certain percentage of the fair market value that is determined by local assessors to be the total taxable value of land and additions on the property. | Land | Improvement |
|---|---|---|---|---|
| 2024 | $7,252 | $123,100 | $36,750 | $86,350 |
| 2023 | $7,161 | $123,095 | $36,750 | $86,345 |
| 2022 | $6,077 | $81,380 | $15,720 | $65,660 |
| 2021 | $5,878 | $81,380 | $15,720 | $65,660 |
| 2020 | $5,828 | $81,380 | $15,720 | $65,660 |
| 2019 | $4,869 | $67,840 | $13,130 | $54,710 |
| 2018 | $4,736 | $67,840 | $13,130 | $54,710 |
| 2017 | $4,469 | $67,840 | $13,130 | $54,710 |
| 2016 | $4,633 | $64,060 | $14,530 | $49,530 |
| 2015 | $4,637 | $64,060 | $14,530 | $49,530 |
| 2014 | $4,601 | $64,060 | $14,530 | $49,530 |
| 2013 | $2,285 | $64,050 | $14,525 | $49,525 |
Source: Public Records
Map
Nearby Homes
- 642 Ridenour Rd
- 536 Springwood Lake Dr
- 108 Walcreek Dr W
- 638 Thistle Ave
- 111 Nob Hill Dr N
- 402 Bluestem Ave
- 459 Bluestem Ave
- 3877 Hines Rd
- 3118 Berkley Pointe Dr
- 388 Elkwood Place
- 3150 Berkley Pointe Dr
- 295 Imperial Dr
- 3544 Halpern St
- 0 Wendler Blvd
- 211 Crossing Creek N
- 249 Regents Rd
- 3555 Tami Place
- 209 Imperial Dr
- 343 Amesbury Dr
- 4125 Emerius Dr
- 613 Ridenour Rd
- 597 Ridenour Rd
- 625 Ridenour Rd
- 589 Ridenour Rd
- 604 Ridenour Rd
- 596 Ridenour Rd
- 637 Ridenour Rd
- 618 Ridenour Rd
- 588 Ridenour Rd
- 647 Ridenour Rd
- 349 Ridenour Rd
- 655 Ridenour Rd
- 624 Ridenour Rd
- 632 Ridenour Rd
- 576 Pinegrove Place
- 572 Pinegrove Place
- 3845 N Stygler Rd
- 579 Pinegrove Place
- 638 Ridenour Rd
- 3855 N Stygler Rd