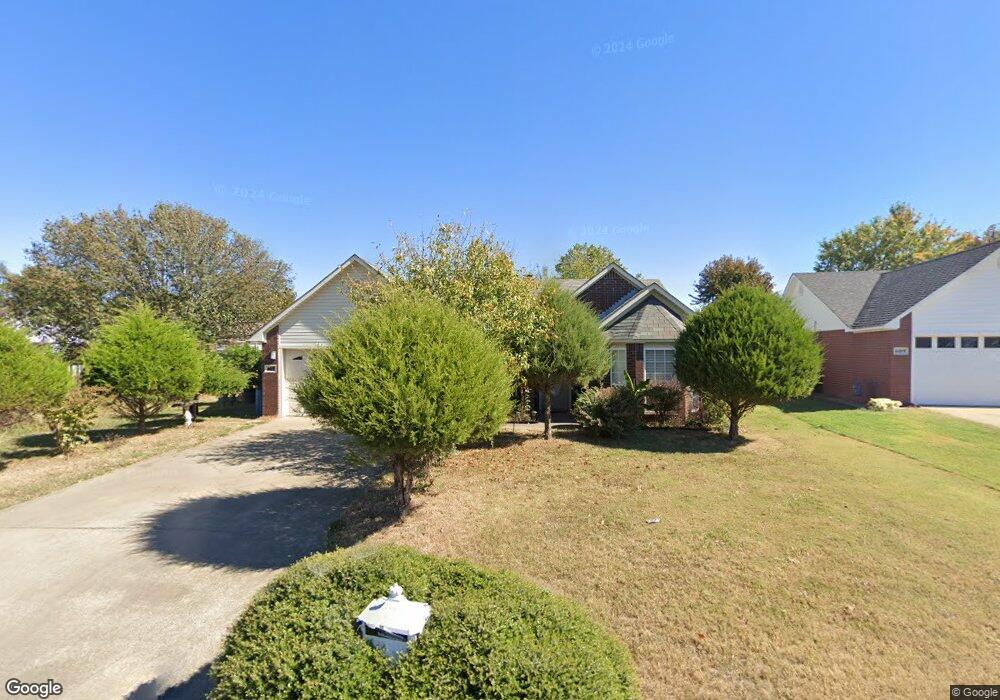
605 S 38th St van Buren, AR 72956
Estimated Value: $192,000 - $196,000
--
Bed
2
Baths
1,293
Sq Ft
$150/Sq Ft
Est. Value
About This Home
This home is located at 605 S 38th St, van Buren, AR 72956 and is currently estimated at $193,991, approximately $150 per square foot. 605 S 38th St is a home located in Crawford County with nearby schools including King Elementary School, Butterfield Trail Middle School, and Van Buren High School.
Ownership History
Date
Name
Owned For
Owner Type
Purchase Details
Closed on
Jun 25, 2007
Sold by
U S Bank Na
Bought by
Nguyen Ninh
Current Estimated Value
Home Financials for this Owner
Home Financials are based on the most recent Mortgage that was taken out on this home.
Original Mortgage
$68,800
Interest Rate
6.19%
Mortgage Type
New Conventional
Purchase Details
Closed on
Feb 14, 2007
Sold by
Jennings Michael W
Bought by
U S Bank Na
Purchase Details
Closed on
Jun 18, 2003
Bought by
Ronald Ragan-Jennings
Create a Home Valuation Report for This Property
The Home Valuation Report is an in-depth analysis detailing your home's value as well as a comparison with similar homes in the area
Home Values in the Area
Average Home Value in this Area
Purchase History
| Date | Buyer | Sale Price | Title Company |
|---|---|---|---|
| Nguyen Ninh | $86,000 | -- | |
| U S Bank Na | -- | -- | |
| Ronald Ragan-Jennings | $96,000 | -- |
Source: Public Records
Mortgage History
| Date | Status | Borrower | Loan Amount |
|---|---|---|---|
| Closed | Nguyen Ninh | $68,800 |
Source: Public Records
Tax History Compared to Growth
Tax History
| Year | Tax Paid | Tax Assessment Tax Assessment Total Assessment is a certain percentage of the fair market value that is determined by local assessors to be the total taxable value of land and additions on the property. | Land | Improvement |
|---|---|---|---|---|
| 2025 | $503 | $32,070 | $3,300 | $28,770 |
| 2024 | $555 | $32,070 | $3,300 | $28,770 |
| 2023 | $582 | $32,070 | $3,300 | $28,770 |
| 2022 | $584 | $18,480 | $3,300 | $15,180 |
| 2021 | $584 | $18,480 | $3,300 | $15,180 |
| 2020 | $584 | $18,480 | $3,300 | $15,180 |
| 2019 | $584 | $18,480 | $3,300 | $15,180 |
| 2018 | $609 | $18,480 | $3,300 | $15,180 |
| 2017 | $666 | $19,570 | $3,300 | $16,270 |
| 2016 | $666 | $19,570 | $3,300 | $16,270 |
| 2015 | $607 | $19,570 | $3,300 | $16,270 |
| 2014 | $607 | $19,570 | $3,300 | $16,270 |
Source: Public Records
Map
Nearby Homes