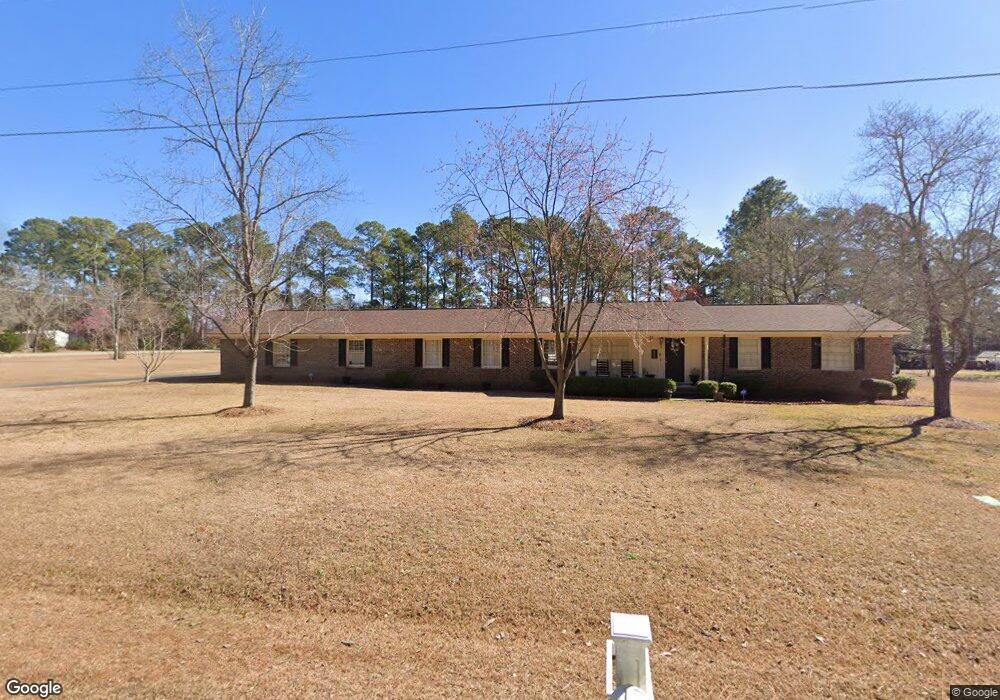
605 S College St Metter, GA 30439
Estimated Value: $284,904 - $477,000
4
Beds
3
Baths
3,120
Sq Ft
$118/Sq Ft
Est. Value
About This Home
This home is located at 605 S College St, Metter, GA 30439 and is currently estimated at $368,976, approximately $118 per square foot. 605 S College St is a home located in Candler County with nearby schools including Metter Elementary School, Metter Intermediate School, and Metter Middle School.
Ownership History
Date
Name
Owned For
Owner Type
Purchase Details
Closed on
Dec 7, 2020
Sold by
Childs Elizabeth Ann Hilderbrand
Bought by
Villasana Tomas Camacho and Villasana Lidia M
Current Estimated Value
Home Financials for this Owner
Home Financials are based on the most recent Mortgage that was taken out on this home.
Original Mortgage
$164,650
Outstanding Balance
$146,588
Interest Rate
2.7%
Mortgage Type
New Conventional
Estimated Equity
$222,388
Purchase Details
Closed on
Jun 1, 2020
Sold by
Minchew Joe Sylvan
Bought by
Childs Elizabeth Ann and Becker Donna Sue
Purchase Details
Closed on
Nov 3, 2015
Sold by
Minchew Sarah C
Bought by
Minchew Joe S
Purchase Details
Closed on
Sep 1, 1991
Sold by
Metter Banking Co
Bought by
Minchew Joe and Minchew Sarah
Purchase Details
Closed on
Jul 1, 1991
Sold by
Brinson Charles
Bought by
Metter Banking Co
Purchase Details
Closed on
Nov 1, 1974
Bought by
Brinson Charles
Create a Home Valuation Report for This Property
The Home Valuation Report is an in-depth analysis detailing your home's value as well as a comparison with similar homes in the area
Home Values in the Area
Average Home Value in this Area
Purchase History
| Date | Buyer | Sale Price | Title Company |
|---|---|---|---|
| Villasana Tomas Camacho | $187,500 | -- | |
| Childs Elizabeth Ann | -- | -- | |
| Minchew Joe S | -- | -- | |
| Minchew Joe | $66,000 | -- | |
| Metter Banking Co | $30,000 | -- | |
| Brinson Charles | $34,500 | -- |
Source: Public Records
Mortgage History
| Date | Status | Borrower | Loan Amount |
|---|---|---|---|
| Open | Villasana Tomas Camacho | $164,650 |
Source: Public Records
Tax History Compared to Growth
Tax History
| Year | Tax Paid | Tax Assessment Tax Assessment Total Assessment is a certain percentage of the fair market value that is determined by local assessors to be the total taxable value of land and additions on the property. | Land | Improvement |
|---|---|---|---|---|
| 2024 | $3,808 | $91,529 | $8,229 | $83,300 |
| 2023 | $3,808 | $88,040 | $8,229 | $79,811 |
| 2022 | $3,192 | $76,279 | $8,229 | $68,050 |
| 2021 | $2,847 | $67,819 | $8,229 | $59,590 |
| 2020 | $2,819 | $66,948 | $7,358 | $59,590 |
| 2019 | $2,856 | $67,311 | $7,358 | $59,953 |
| 2018 | $2,528 | $63,464 | $7,358 | $56,106 |
| 2017 | $2,155 | $64,335 | $8,229 | $56,106 |
| 2016 | $2,394 | $64,335 | $8,229 | $56,106 |
| 2015 | $2,298 | $64,391 | $8,229 | $56,162 |
| 2014 | $2,298 | $64,391 | $8,229 | $56,162 |
Source: Public Records
Map
Nearby Homes
- 550 S Rountree St
- 450 S Rountree St
- 405 Preston St
- 405 S Leroy St
- 365 S Leroy St
- 295 S Lewis St
- 250 S Lewis St
- 245 N Terrell St
- 40 Hickory St
- 465 Cedar St
- 286 Webb Cir
- 0 Central Ave Unit 10628403
- 0 Oak Tree Rd Unit (31.62 AC) 10490874
- 150 W Willow Lake Dr
- 4515 Harper Rd
- 1449 Hulsey Dr
- 0 Indigo Rd Unit 10425491
- 743 Ann's Ln
- 6424 Collins Rd
- 0 Canoochee Rd Unit 10565737
- 600 S Kennedy St
- 600 S College St
- 600 S College St
- 609 S College St
- 620 S Kennedy St
- 606 S College St
- 630 S Kennedy St
- 530 S Kennedy St
- 610 S College St
- 640 S Kennedy St
- 522 S Kennedy St
- 605 S Kennedy St
- 390 W Jeanette St
- 615 S Kennedy St
- 615 S Kennedy St
- 600 Thompson St
- 625 S Kennedy St
- 610 Thompson St
- 545 S Kennedy St
- 505 S College St