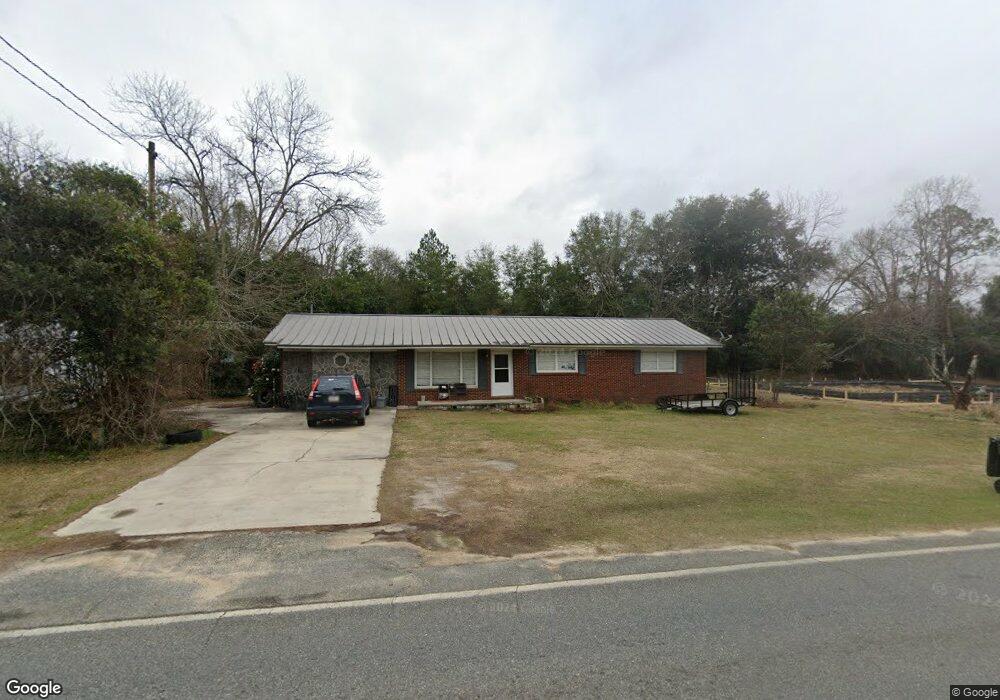
605 S Leroy St Unit 3,4 Metter, GA 30439
Estimated Value: $188,000 - $235,000
3
Beds
3
Baths
1,651
Sq Ft
$127/Sq Ft
Est. Value
About This Home
This home is located at 605 S Leroy St Unit 3,4, Metter, GA 30439 and is currently estimated at $208,927, approximately $126 per square foot. 605 S Leroy St Unit 3,4 is a home located in Candler County with nearby schools including Metter Elementary School, Metter Intermediate School, and Metter Middle School.
Ownership History
Date
Name
Owned For
Owner Type
Purchase Details
Closed on
Apr 18, 2025
Sold by
Bogey Free Investments Llc
Bought by
Barrett Brandon Michael
Current Estimated Value
Home Financials for this Owner
Home Financials are based on the most recent Mortgage that was taken out on this home.
Original Mortgage
$205,000
Outstanding Balance
$204,459
Interest Rate
6.67%
Mortgage Type
VA
Estimated Equity
$4,468
Purchase Details
Closed on
Dec 31, 2016
Sold by
Billy
Bought by
Lanier Stevie
Purchase Details
Closed on
Dec 6, 2016
Sold by
Charles E
Bought by
Patterson Billy E
Purchase Details
Closed on
Nov 15, 2007
Sold by
Alcott James E
Bought by
Snowden Charles E
Home Financials for this Owner
Home Financials are based on the most recent Mortgage that was taken out on this home.
Original Mortgage
$80,000
Interest Rate
6.36%
Mortgage Type
New Conventional
Purchase Details
Closed on
Jun 28, 2001
Sold by
Alcott Louise B
Bought by
Alcott James E
Purchase Details
Closed on
Jun 2, 1998
Sold by
Reynolds Robert J
Bought by
Alcott James E
Purchase Details
Closed on
Jun 1, 1977
Sold by
Coursey Ray
Bought by
Reynolds Robert J
Purchase Details
Closed on
Mar 1, 1977
Sold by
Manuel Toby Mrs
Bought by
Coursey Ray
Create a Home Valuation Report for This Property
The Home Valuation Report is an in-depth analysis detailing your home's value as well as a comparison with similar homes in the area
Home Values in the Area
Average Home Value in this Area
Purchase History
| Date | Buyer | Sale Price | Title Company |
|---|---|---|---|
| Barrett Brandon Michael | $205,000 | -- | |
| Bogey Free Investments Llc | -- | -- | |
| Lanier Stevie | $34,181 | -- | |
| Bogey Free Investments Inc | $34,181 | -- | |
| Patterson Billy E | $31,544 | -- | |
| Snowden Charles E | $20,000 | -- | |
| Snowden Charles E | $80,000 | -- | |
| Alcott James E | -- | -- | |
| Alcott James E | $48,000 | -- | |
| Reynolds Robert J | $22,500 | -- | |
| Coursey Ray | $20,500 | -- |
Source: Public Records
Mortgage History
| Date | Status | Borrower | Loan Amount |
|---|---|---|---|
| Open | Bogey Free Investments Llc | $205,000 | |
| Previous Owner | Snowden Charles E | $80,000 |
Source: Public Records
Tax History Compared to Growth
Tax History
| Year | Tax Paid | Tax Assessment Tax Assessment Total Assessment is a certain percentage of the fair market value that is determined by local assessors to be the total taxable value of land and additions on the property. | Land | Improvement |
|---|---|---|---|---|
| 2024 | $1,826 | $40,976 | $3,058 | $37,918 |
| 2023 | $1,826 | $39,275 | $3,058 | $36,217 |
| 2022 | $1,559 | $34,375 | $3,058 | $31,317 |
| 2021 | $1,365 | $29,844 | $3,058 | $26,786 |
| 2020 | $1,367 | $29,844 | $3,058 | $26,786 |
| 2019 | $1,345 | $29,014 | $2,563 | $26,451 |
| 2018 | $1,077 | $27,044 | $2,563 | $24,481 |
| 2017 | $942 | $28,120 | $3,639 | $24,481 |
| 2016 | $1,595 | $38,969 | $6,115 | $32,854 |
| 2015 | $1,460 | $39,954 | $6,115 | $33,839 |
| 2014 | $1,460 | $39,954 | $6,115 | $33,839 |
Source: Public Records
Map
Nearby Homes
- 550 S Rountree St
- 405 S Leroy St
- 450 S Rountree St
- 365 S Leroy St
- 295 S Lewis St
- 250 S Lewis St
- 405 Preston St
- 245 N Terrell St
- 40 Hickory St
- 465 Cedar St
- 0 Oak Tree Rd Unit (31.62 AC) 10490874
- 286 Webb Cir
- 0 Central Ave Unit 10628403
- 150 W Willow Lake Dr
- 4515 Harper Rd
- 1449 Hulsey Dr
- 0 Indigo Rd Unit 10425491
- 0 Canoochee Rd Unit 10565737
- 6424 Collins Rd
- 743 Ann's Ln
- 607 S Leroy St
- 603 S Leroy St
- 601 S Leroy St
- 608 S Leroy St
- 609 S Leroy St
- 600 S Leroy St
- 632 S Leroy St
- 410 S Leroy St
- 611 S Leroy St
- 615 S Lewis St
- 605 S Lewis St
- 516 S Leroy St
- 513 S Leroy St
- 613 S Leroy St
- 512 S Leroy St
- 545 S Lewis St
- 636 S Leroy St
- 0 S Lewis St Unit 12815
- 0 S Lewis St Unit 7067893
- 0 S Lewis St Unit 7452388