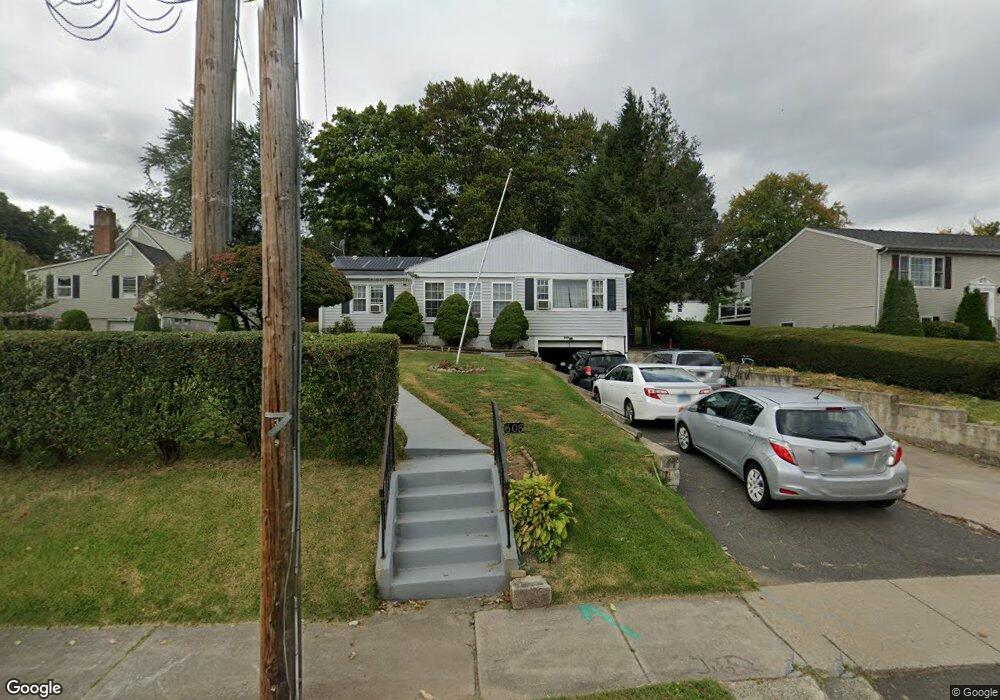
605 S Main St West Hartford, CT 06110
Estimated Value: $367,821 - $393,000
3
Beds
1
Bath
1,324
Sq Ft
$288/Sq Ft
Est. Value
About This Home
This home is located at 605 S Main St, West Hartford, CT 06110 and is currently estimated at $381,205, approximately $287 per square foot. 605 S Main St is a home located in Hartford County with nearby schools including Wolcott School, Sedgwick Middle School, and Conard High School.
Ownership History
Date
Name
Owned For
Owner Type
Purchase Details
Closed on
Mar 3, 1999
Sold by
Silbo Mark M and Silbo Diane L
Bought by
Dean Agree G and Dean Carith K
Current Estimated Value
Home Financials for this Owner
Home Financials are based on the most recent Mortgage that was taken out on this home.
Original Mortgage
$115,692
Interest Rate
6.76%
Create a Home Valuation Report for This Property
The Home Valuation Report is an in-depth analysis detailing your home's value as well as a comparison with similar homes in the area
Home Values in the Area
Average Home Value in this Area
Purchase History
| Date | Buyer | Sale Price | Title Company |
|---|---|---|---|
| Dean Agree G | $116,000 | -- |
Source: Public Records
Mortgage History
| Date | Status | Borrower | Loan Amount |
|---|---|---|---|
| Closed | Dean Agree G | $136,000 | |
| Closed | Dean Agree G | $137,700 | |
| Closed | Dean Agree G | $115,692 | |
| Previous Owner | Dean Agree G | $108,350 |
Source: Public Records
Tax History Compared to Growth
Tax History
| Year | Tax Paid | Tax Assessment Tax Assessment Total Assessment is a certain percentage of the fair market value that is determined by local assessors to be the total taxable value of land and additions on the property. | Land | Improvement |
|---|---|---|---|---|
| 2025 | $6,810 | $152,080 | $48,200 | $103,880 |
| 2024 | $6,441 | $152,080 | $48,200 | $103,880 |
| 2023 | $6,223 | $152,080 | $48,200 | $103,880 |
| 2022 | $6,187 | $152,080 | $48,200 | $103,880 |
| 2021 | $5,413 | $127,610 | $48,200 | $79,410 |
| 2020 | $5,334 | $127,610 | $41,000 | $86,610 |
| 2019 | $5,334 | $127,610 | $41,020 | $86,590 |
| 2018 | $5,232 | $127,610 | $41,020 | $86,590 |
| 2017 | $5,237 | $127,610 | $41,020 | $86,590 |
| 2016 | $5,570 | $140,980 | $47,250 | $93,730 |
| 2015 | $5,401 | $140,980 | $47,250 | $93,730 |
| 2014 | $5,033 | $134,680 | $47,250 | $87,430 |
Source: Public Records
Map
Nearby Homes
- 305 Hampton Ct
- 20 Surrey Dr Unit B16 aka B4
- 54 Red Top Dr
- 148 Colonial St
- 16 Thornton Dr
- 107 Westgate St
- 479 S Main St
- 25 Fowler Dr
- 24 Thorne Rd Unit 24
- 18 Federal St
- 31 Dacosta Dr
- 61 Colonial St
- 228 Reservoir Rd
- 121 Cambridge St
- 49 Somerset St
- 47 Francis Dr
- 41 Page Ave
- 422 S Main St
- 29 Sunnyside Rd
- 1145 New Britain Ave
- 4 Greenhouse Blvd
- 597 S Main St
- 8 Greenhouse Blvd
- 601 S Main St
- 7 Baldwin St
- 12 Greenhouse Blvd
- 602 S Main St
- 606 S Main St
- 11 Baldwin St
- 1 Greenhouse Blvd
- 608 S Main St
- 600 S Main St
- 7 Greenhouse Blvd
- 610 S Main St
- 14 Greenhouse Blvd
- 593 S Main St
- 15 Baldwin St
- 596 S Main St
- 614 S Main St
- 11 Greenhouse Blvd