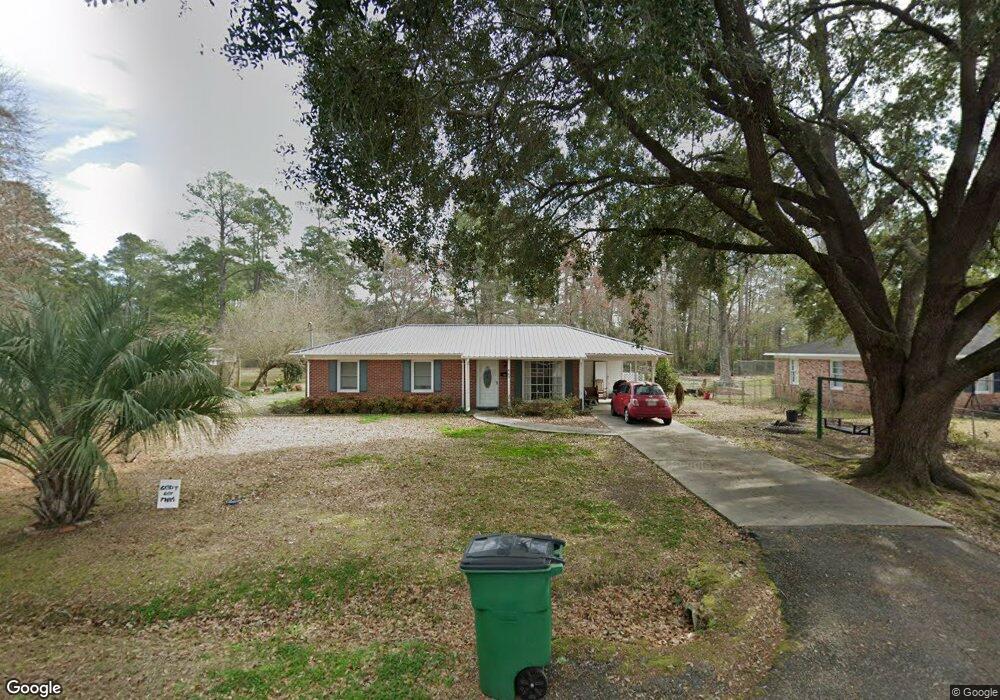
605 S Poplar Ave Andrews, SC 29510
Estimated Value: $214,000 - $228,429
3
Beds
2
Baths
1,433
Sq Ft
$155/Sq Ft
Est. Value
About This Home
This home is located at 605 S Poplar Ave, Andrews, SC 29510 and is currently estimated at $222,357, approximately $155 per square foot. 605 S Poplar Ave is a home located in Georgetown County with nearby schools including Andrews Elementary School, Rosemary Middle School, and Andrews High School.
Ownership History
Date
Name
Owned For
Owner Type
Purchase Details
Closed on
Mar 26, 2024
Sold by
Cooper Donald E
Bought by
Donald E Cooper Iii Living Trust and Cooper
Current Estimated Value
Purchase Details
Closed on
Sep 22, 2023
Sold by
Jahanbakhsh Azin and West Marcey
Bought by
Cooper Donald E
Home Financials for this Owner
Home Financials are based on the most recent Mortgage that was taken out on this home.
Original Mortgage
$181,649
Interest Rate
7.09%
Mortgage Type
FHA
Purchase Details
Closed on
Jun 25, 2021
Sold by
Newton Marvin Dalton
Bought by
Jahanbakhsh Azin and West Marcey
Purchase Details
Closed on
Jun 16, 2021
Sold by
Wiles Catherine Newton
Bought by
Newton Marvin Dalton
Purchase Details
Closed on
May 4, 2001
Sold by
Powell Delaine Z
Bought by
Wiles Catherine M
Purchase Details
Closed on
Oct 20, 1999
Sold by
United Companies Lending Corp
Bought by
Powell Delaine Z
Create a Home Valuation Report for This Property
The Home Valuation Report is an in-depth analysis detailing your home's value as well as a comparison with similar homes in the area
Home Values in the Area
Average Home Value in this Area
Purchase History
| Date | Buyer | Sale Price | Title Company |
|---|---|---|---|
| Donald E Cooper Iii Living Trust | -- | None Listed On Document | |
| Cooper Donald E | $185,000 | None Listed On Document | |
| Jahanbakhsh Azin | $123,000 | None Available | |
| Newton Marvin Dalton | -- | None Available | |
| Wiles Catherine M | $70,000 | -- | |
| Powell Delaine Z | $25,000 | -- |
Source: Public Records
Mortgage History
| Date | Status | Borrower | Loan Amount |
|---|---|---|---|
| Previous Owner | Cooper Donald E | $181,649 |
Source: Public Records
Tax History Compared to Growth
Tax History
| Year | Tax Paid | Tax Assessment Tax Assessment Total Assessment is a certain percentage of the fair market value that is determined by local assessors to be the total taxable value of land and additions on the property. | Land | Improvement |
|---|---|---|---|---|
| 2024 | $1,294 | $7,050 | $480 | $6,570 |
| 2023 | $1,294 | $4,470 | $250 | $4,220 |
| 2022 | $622 | $4,470 | $250 | $4,220 |
| 2021 | $435 | $3,700 | $248 | $3,452 |
| 2020 | $435 | $3,700 | $248 | $3,452 |
| 2019 | $371 | $3,428 | $248 | $3,180 |
| 2018 | $384 | $34,280 | $0 | $0 |
| 2017 | $321 | $34,280 | $0 | $0 |
| 2016 | $319 | $3,428 | $0 | $0 |
| 2015 | $313 | $0 | $0 | $0 |
| 2014 | $320 | $82,400 | $6,200 | $76,200 |
| 2012 | -- | $82,400 | $6,200 | $76,200 |
Source: Public Records
Map
Nearby Homes
- 512 S Hazel Ave
- 40 W Balsam St
- 406 S Rosemary Ave
- 301 S Morgan Ave
- 402 S Magnolia Ave
- 304 S Magnolia Ave
- 2 Lots - TBD S Rosemary Ave
- TBD S Rosemary Ave Unit lot 9
- TBD S Rosemary Ave Unit lot 8
- 109 S Maple Ave
- 112 S Rosemary Ave
- 96 Smokethorn St
- 208 W Main St
- 6 S Rosemary Ave
- 5 S Rosemary Ave
- 128 Highway 521
- 7 Orange Blossom St
- 106 Jessamine St
- 15 Mango St
- 213 N Magnolia Ave
- 607 S Poplar Ave
- 609 S Poplar Ave
- 602 S Beech Ave
- 611 S Poplar Ave
- 611 S Poplar Ave
- 602 S Poplar Ave
- 606 S Poplar Ave
- 608 S Poplar Ave
- 509 S Poplar Ave
- 610 S Poplar Ave
- 512 S Beech Ave
- 702 S Poplar Ave
- 203 W Juniper St
- 203 W Juniper St
- 203 W Juniper St
- 705 S Poplar Ave
- 702 S Beech Ave
- 605 S Cedar Ave
- 609 S Beech Ave
- 601 S Cedar Ave