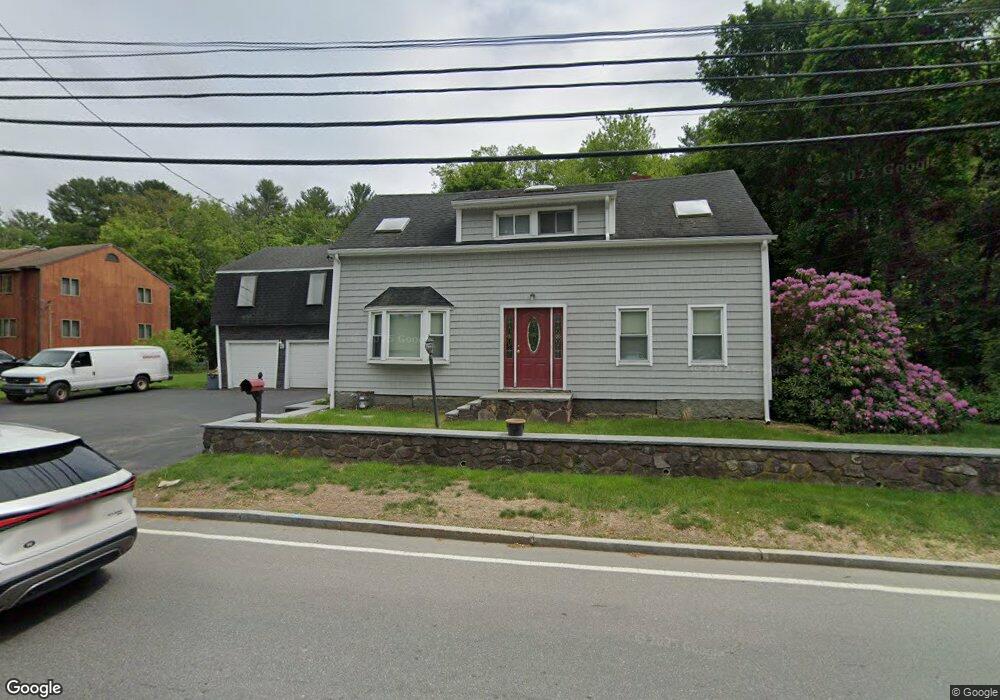
605 Salem St Unit 1 Lynnfield, MA 01940
Estimated Value: $771,000 - $891,000
4
Beds
2
Baths
2,000
Sq Ft
$421/Sq Ft
Est. Value
About This Home
This home is located at 605 Salem St Unit 1, Lynnfield, MA 01940 and is currently estimated at $841,552, approximately $420 per square foot. 605 Salem St Unit 1 is a home located in Essex County with nearby schools including Lynnfield Middle School, Pickering Middle School, and Lynnfield High School.
Ownership History
Date
Name
Owned For
Owner Type
Purchase Details
Closed on
Mar 9, 2004
Sold by
Vellante Mark and Vellante Tammy J
Bought by
Vellante Mark
Current Estimated Value
Purchase Details
Closed on
Jul 29, 1992
Sold by
Glendale Coop Bk
Bought by
Vellante Mark and Vellante Tammy J
Purchase Details
Closed on
Oct 5, 1989
Sold by
Tsatsis K
Bought by
Morando James
Create a Home Valuation Report for This Property
The Home Valuation Report is an in-depth analysis detailing your home's value as well as a comparison with similar homes in the area
Home Values in the Area
Average Home Value in this Area
Purchase History
| Date | Buyer | Sale Price | Title Company |
|---|---|---|---|
| Vellante Mark | -- | -- | |
| Vellante Mark | $148,500 | -- | |
| Morando James | $210,000 | -- |
Source: Public Records
Mortgage History
| Date | Status | Borrower | Loan Amount |
|---|---|---|---|
| Open | Morando James | $444,000 | |
| Closed | Morando James | $462,750 |
Source: Public Records
Tax History Compared to Growth
Tax History
| Year | Tax Paid | Tax Assessment Tax Assessment Total Assessment is a certain percentage of the fair market value that is determined by local assessors to be the total taxable value of land and additions on the property. | Land | Improvement |
|---|---|---|---|---|
| 2025 | $7,112 | $673,500 | $464,900 | $208,600 |
| 2024 | $6,741 | $641,400 | $442,700 | $198,700 |
| 2023 | $6,197 | $548,400 | $367,500 | $180,900 |
| 2022 | $5,796 | $483,400 | $332,500 | $150,900 |
| 2021 | $5,908 | $445,200 | $308,000 | $137,200 |
| 2020 | $5,581 | $400,900 | $277,900 | $123,000 |
| 2019 | $5,193 | $373,300 | $250,300 | $123,000 |
| 2018 | $5,137 | $373,300 | $250,300 | $123,000 |
| 2017 | $4,830 | $350,500 | $227,500 | $123,000 |
| 2016 | $4,917 | $339,100 | $227,500 | $111,600 |
| 2015 | $4,551 | $314,100 | $203,100 | $111,000 |
Source: Public Records
Map
Nearby Homes
- 344 Broadway
- 6 Longbow Rd
- 807 Salem St
- 16 Munroe St
- 2 Cedarwood Rd
- 37 Locust St
- 14 Rockwood Rd
- 9 Broadway Unit 217
- 9 Broadway Unit 305
- 5 Otter Pond Rd
- 9 Fernway
- 1100 Salem St Unit 58
- 1100 Salem St Unit 46
- 1100 Salem St Unit 93
- 1100 Salem St Unit 75
- 42 Walnut St
- 51 Walnut St
- 1200 Salem St Unit 182
- 3 Elliot Rd
- 159 Judge Rd
- 605 Salem St
- 607 Salem St
- 585 Salem St
- 623 Salem St
- 20 Carpenter Rd
- 633 Salem St
- 624 Salem St
- 579 Salem St
- 628 Salem St Unit 1A &B
- 628 Salem St Unit 1 st fl
- 8 Willowdale Dr
- 569 Salem St
- 14 Post Office Square
- 1 Squire Ln
- 1 Post Office Square
- 651 Salem St
- 19 Carpenter Rd
- 648 Salem St
- 6 Willowdale Dr
- 581 Salem St