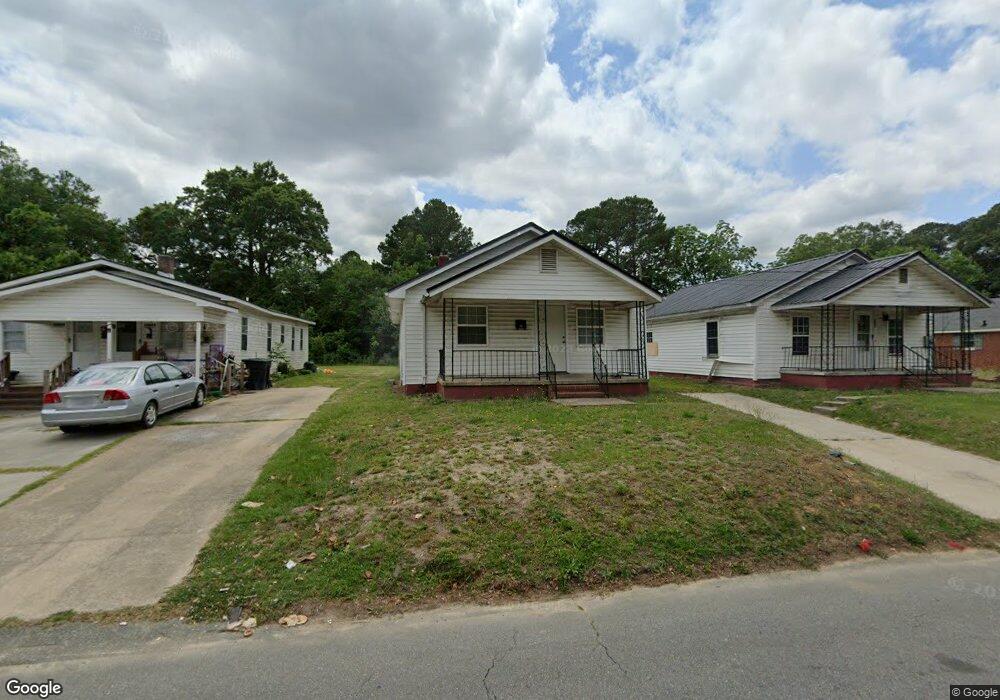
605 Sampson St Clinton, NC 28328
Estimated Value: $128,000 - $135,000
3
Beds
1
Bath
864
Sq Ft
$151/Sq Ft
Est. Value
About This Home
This home is located at 605 Sampson St, Clinton, NC 28328 and is currently estimated at $130,667, approximately $151 per square foot. 605 Sampson St is a home located in Sampson County with nearby schools including Langdon C. Kerr Elementary School, Sunset Avenue Elementary School, and Butler Avenue Elementary School.
Ownership History
Date
Name
Owned For
Owner Type
Purchase Details
Closed on
Mar 11, 2025
Sold by
Mcrae Patricia and Martin Miriam
Bought by
Elshaddai Solutions Llc
Current Estimated Value
Home Financials for this Owner
Home Financials are based on the most recent Mortgage that was taken out on this home.
Original Mortgage
$173,850
Outstanding Balance
$88,433
Interest Rate
6.96%
Mortgage Type
Construction
Estimated Equity
$42,234
Purchase Details
Closed on
Jul 5, 1977
Bought by
Mcrae Moses J
Create a Home Valuation Report for This Property
The Home Valuation Report is an in-depth analysis detailing your home's value as well as a comparison with similar homes in the area
Home Values in the Area
Average Home Value in this Area
Purchase History
| Date | Buyer | Sale Price | Title Company |
|---|---|---|---|
| Elshaddai Solutions Llc | $128,500 | None Listed On Document | |
| Mcrae Moses J | -- | -- |
Source: Public Records
Mortgage History
| Date | Status | Borrower | Loan Amount |
|---|---|---|---|
| Open | Elshaddai Solutions Llc | $173,850 |
Source: Public Records
Tax History Compared to Growth
Tax History
| Year | Tax Paid | Tax Assessment Tax Assessment Total Assessment is a certain percentage of the fair market value that is determined by local assessors to be the total taxable value of land and additions on the property. | Land | Improvement |
|---|---|---|---|---|
| 2025 | $1,460 | $128,110 | $12,451 | $115,659 |
| 2024 | $1,384 | $128,110 | $12,451 | $115,659 |
| 2023 | $796 | $58,071 | $10,837 | $47,234 |
| 2022 | $796 | $58,071 | $10,837 | $47,234 |
| 2021 | $796 | $58,071 | $10,837 | $47,234 |
| 2020 | $796 | $58,071 | $10,837 | $47,234 |
| 2019 | $796 | $58,071 | $0 | $0 |
| 2018 | $715 | $52,209 | $0 | $0 |
| 2017 | $715 | $52,209 | $0 | $0 |
| 2016 | $910 | $52,209 | $0 | $0 |
| 2015 | $718 | $52,209 | $0 | $0 |
| 2014 | $718 | $52,209 | $0 | $0 |
Source: Public Records
Map
Nearby Homes