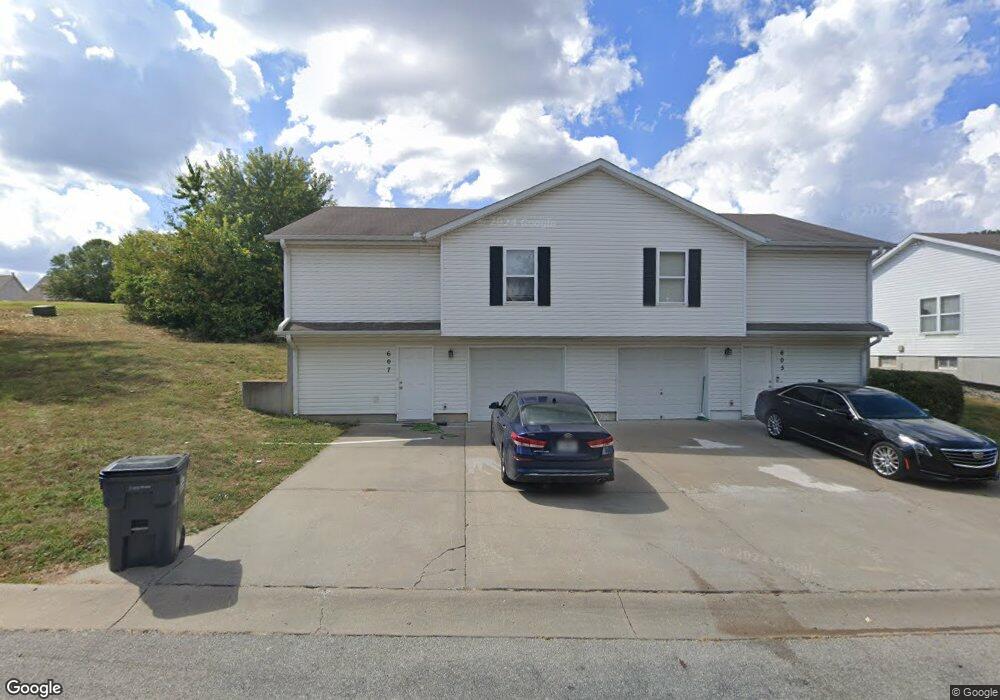
605 SW Pinebrook Village Ct Blue Springs, MO 64015
Estimated Value: $295,000 - $421,000
2
Beds
2
Baths
1,600
Sq Ft
$233/Sq Ft
Est. Value
About This Home
This home is located at 605 SW Pinebrook Village Ct, Blue Springs, MO 64015 and is currently estimated at $372,148, approximately $232 per square foot. 605 SW Pinebrook Village Ct is a home located in Jackson County with nearby schools including Franklin Smith Elementary School, Paul Kinder Middle School, and Blue Springs High School.
Ownership History
Date
Name
Owned For
Owner Type
Purchase Details
Closed on
Feb 28, 2022
Sold by
Meeks Loren A and Meeks Kathy J
Bought by
Zhangada Shaiiil and Nguyen Claudia
Current Estimated Value
Purchase Details
Closed on
Jul 6, 2009
Sold by
Bank Of America National Association
Bought by
Meeks Loren A and Meeks Kathy J
Home Financials for this Owner
Home Financials are based on the most recent Mortgage that was taken out on this home.
Original Mortgage
$84,375
Interest Rate
5.41%
Mortgage Type
Seller Take Back
Purchase Details
Closed on
Feb 24, 2009
Sold by
Brooke Paula and Brooke Tom
Bought by
Lasalle Bank National Association
Purchase Details
Closed on
Dec 18, 2000
Sold by
Penn Kenneth W
Bought by
Brooke Tom and Brooke Paula
Create a Home Valuation Report for This Property
The Home Valuation Report is an in-depth analysis detailing your home's value as well as a comparison with similar homes in the area
Home Values in the Area
Average Home Value in this Area
Purchase History
| Date | Buyer | Sale Price | Title Company |
|---|---|---|---|
| Zhangada Shaiiil | -- | Secured Title | |
| Zhangada Shaiiil | -- | Secured Title | |
| Meeks Loren A | $112,500 | None Available | |
| Lasalle Bank National Association | $135,915 | None Available | |
| Brooke Tom | -- | Stewart Title |
Source: Public Records
Mortgage History
| Date | Status | Borrower | Loan Amount |
|---|---|---|---|
| Previous Owner | Meeks Loren A | $84,375 |
Source: Public Records
Tax History Compared to Growth
Tax History
| Year | Tax Paid | Tax Assessment Tax Assessment Total Assessment is a certain percentage of the fair market value that is determined by local assessors to be the total taxable value of land and additions on the property. | Land | Improvement |
|---|---|---|---|---|
| 2025 | $4,563 | $59,301 | $7,344 | $51,957 |
| 2024 | $4,475 | $55,927 | $10,308 | $45,619 |
| 2023 | $4,475 | $55,926 | $7,157 | $48,769 |
| 2022 | $4,060 | $44,840 | $12,930 | $31,910 |
| 2021 | $4,056 | $44,840 | $12,930 | $31,910 |
| 2020 | $3,802 | $42,751 | $12,930 | $29,821 |
| 2019 | $4,284 | $49,834 | $12,930 | $36,904 |
| 2018 | $2,388 | $26,737 | $2,867 | $23,870 |
| 2017 | $2,322 | $26,737 | $2,867 | $23,870 |
| 2016 | $2,322 | $26,068 | $2,261 | $23,807 |
| 2014 | $1,970 | $22,040 | $3,477 | $18,563 |
Source: Public Records
Map
Nearby Homes
- 605 SW Shadow Glen Dr
- 603 SW Shadow Glen Dr
- 601 SW Shadow Glen Dr
- 607 SW Shadow Glen Ct
- 605 SW Shadow Glen Ct
- 630 SW Shadow Glen Ct
- 3341 SW Shadow Glen Dr
- 125 Beach Dr
- 3222 SW Shadow Brook Dr
- 3812 SW McDanial Ave
- 62 Beach Dr
- 3705 SW Kimstin Cir
- 3012 SW Moore St
- 148 Beach Dr
- 308 SW Woods Chapel Rd
- 41 Clipper Dr
- 3665 SW Kimstin Cir
- 27 Beach Dr
- 124 SW 27th St
- 3616 NW Dogwood Dr
- 605 SW Pinebrook Village Ct
- 607 SW Pinebrook Village Ct
- 605 SW Pinebrook Village Ct
- 601 SW Pinebrook Village Ct
- 609 SW Pinebrook Village Ct
- 700 & 702 SW 36th Street Terrace
- 700 SW 36th Street Terrace
- 3508 SW McDanial Ave
- 700 SW Pinebrook Village Dr
- 3512 SW McDanial Ave
- 704 SW 36th Street Terrace
- 706 SW Pinebrook Village Dr
- 3505 SW McDanial Ave
- 3501 SW McDanial Ave
- 701 SW 36th Street Terrace
- 621 SW Shadow Glen Dr
- 3600 SW McDanial Ave
- 527 SW Shadow Glen Dr
- 708 SW 36th Street Terrace
- 708 SW 36th Street Terrace