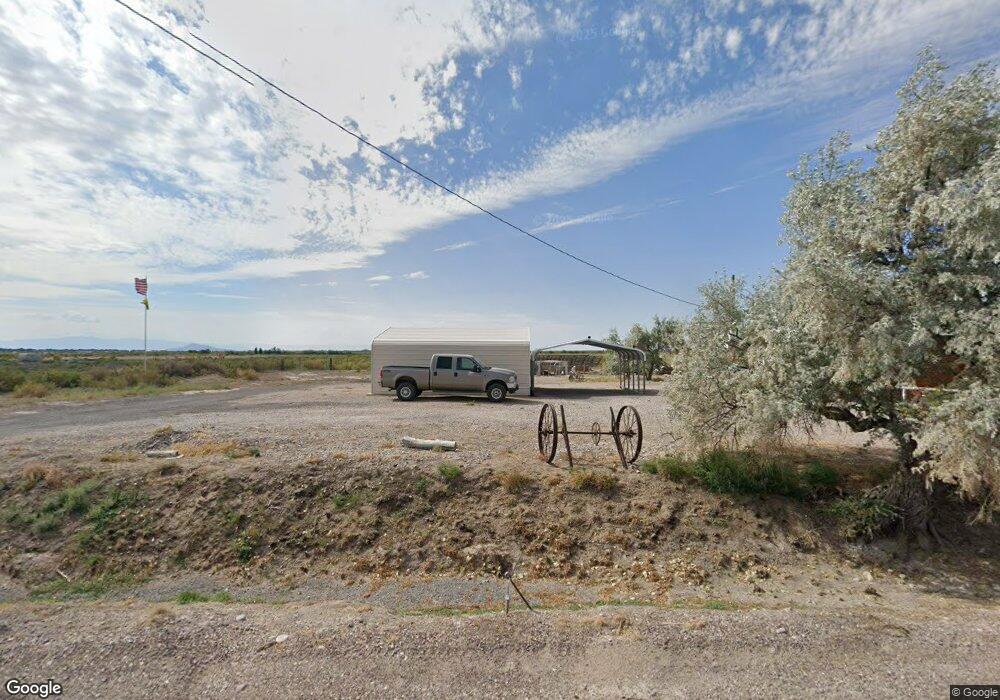
605 W 500 S Hinckley, UT 84635
Estimated Value: $260,000 - $363,549
3
Beds
2
Baths
1,600
Sq Ft
$200/Sq Ft
Est. Value
About This Home
This home is located at 605 W 500 S, Hinckley, UT 84635 and is currently estimated at $320,183, approximately $200 per square foot. 605 W 500 S is a home located in Millard County.
Ownership History
Date
Name
Owned For
Owner Type
Purchase Details
Closed on
Oct 3, 2019
Sold by
Orlandini Claudemir
Bought by
Carter Danielle G and Carter Blaine K
Current Estimated Value
Purchase Details
Closed on
Aug 2, 2016
Sold by
Orlandini Claudemir and Orlandini Zuleide
Bought by
Orlandini Family Trust
Purchase Details
Closed on
Jun 8, 2016
Sold by
Roholt Reed B
Bought by
Orlandini Claudemir and Orlandini Zuleide
Create a Home Valuation Report for This Property
The Home Valuation Report is an in-depth analysis detailing your home's value as well as a comparison with similar homes in the area
Home Values in the Area
Average Home Value in this Area
Purchase History
| Date | Buyer | Sale Price | Title Company |
|---|---|---|---|
| Carter Danielle G | -- | None Available | |
| Orlandini Family Trust | -- | -- | |
| Orlandini Claudemir | -- | First American Title |
Source: Public Records
Tax History Compared to Growth
Tax History
| Year | Tax Paid | Tax Assessment Tax Assessment Total Assessment is a certain percentage of the fair market value that is determined by local assessors to be the total taxable value of land and additions on the property. | Land | Improvement |
|---|---|---|---|---|
| 2025 | $754 | $237,846 | $87,482 | $150,364 |
| 2024 | $754 | $175,727 | $23,805 | $151,922 |
| 2023 | $631 | $175,727 | $23,805 | $151,922 |
| 2022 | $315 | $124,579 | $22,901 | $101,678 |
| 2021 | $294 | $84,826 | $19,084 | $65,742 |
| 2020 | $1,513 | $119,819 | $18,900 | $100,919 |
| 2019 | $1,456 | $116,206 | $18,900 | $97,306 |
| 2018 | $1,420 | $116,206 | $18,900 | $97,306 |
| 2017 | $1,479 | $116,206 | $18,900 | $97,306 |
| 2016 | $867 | $69,929 | $15,075 | $54,854 |
| 2015 | $677 | $53,875 | $14,305 | $39,570 |
| 2014 | -- | $53,875 | $14,305 | $39,570 |
| 2013 | -- | $52,723 | $14,305 | $38,418 |
Source: Public Records
Map
Nearby Homes
- 289 W Center St S
- 1040 W Center St
- 168 N 100 Rd W
- 6500 W 2000 S
- 1025 N Main St
- 3480 S 4000 W
- 3770 S 4000 Rd W
- 700 Acres
- 1500 S 10000 W
- 6000 N 10000 W
- 700 Acres Hwy 6 & Main St (Hwy 50)
- 2000 E 10500 N
- 6200 S 3000 W
- 3885 W 4500 S
- 0 Tbd 3000 Rd S Unit LotWP001
- 6177 S 3000 Rd W
- 6500 S 3000 West Rd
- 470 S 2750 W Unit 6
- 460 S 2750 W Unit 7
- 490 S 2750 W Unit 5