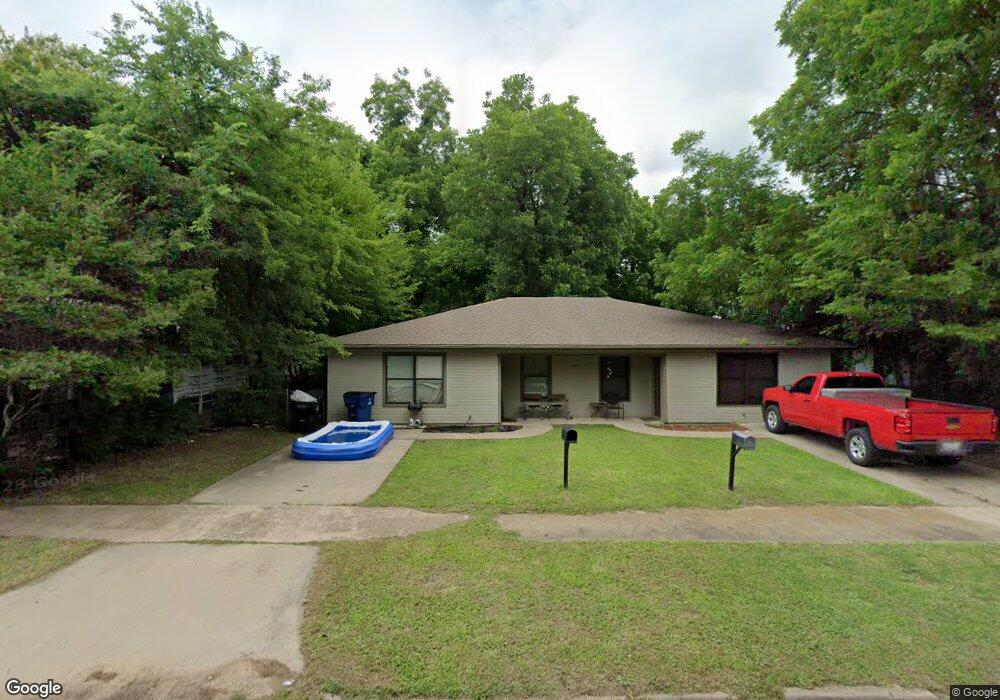
605 W Day St Unit 101 Denison, TX 75020
Estimated Value: $237,996 - $261,000
--
Bed
--
Bath
1,938
Sq Ft
$129/Sq Ft
Est. Value
About This Home
This home is located at 605 W Day St Unit 101, Denison, TX 75020 and is currently estimated at $249,498, approximately $128 per square foot. 605 W Day St Unit 101 is a home located in Grayson County with nearby schools including Houston Elementary School, Scott Middle School, and Denison High School.
Ownership History
Date
Name
Owned For
Owner Type
Purchase Details
Closed on
Apr 22, 2022
Sold by
Harold Cleveland
Bought by
Red Sofa Properties Llc
Current Estimated Value
Home Financials for this Owner
Home Financials are based on the most recent Mortgage that was taken out on this home.
Original Mortgage
$165,750
Outstanding Balance
$157,029
Interest Rate
5.11%
Mortgage Type
New Conventional
Estimated Equity
$92,469
Purchase Details
Closed on
Apr 20, 2022
Sold by
Harold Cleveland
Bought by
Red Sofa Properties Llc
Home Financials for this Owner
Home Financials are based on the most recent Mortgage that was taken out on this home.
Original Mortgage
$165,750
Outstanding Balance
$157,029
Interest Rate
5.11%
Mortgage Type
New Conventional
Estimated Equity
$92,469
Purchase Details
Closed on
Jun 7, 2006
Sold by
Easter Gerald D
Bought by
Steve Graham Construction Co
Create a Home Valuation Report for This Property
The Home Valuation Report is an in-depth analysis detailing your home's value as well as a comparison with similar homes in the area
Home Values in the Area
Average Home Value in this Area
Purchase History
| Date | Buyer | Sale Price | Title Company |
|---|---|---|---|
| Red Sofa Properties Llc | -- | New Title Company Name | |
| Red Sofa Properties Llc | -- | New Title Company Name | |
| Steve Graham Construction Co | -- | None Available |
Source: Public Records
Mortgage History
| Date | Status | Borrower | Loan Amount |
|---|---|---|---|
| Open | Red Sofa Properties Llc | $165,750 | |
| Closed | Red Sofa Properties Llc | $165,750 |
Source: Public Records
Tax History Compared to Growth
Tax History
| Year | Tax Paid | Tax Assessment Tax Assessment Total Assessment is a certain percentage of the fair market value that is determined by local assessors to be the total taxable value of land and additions on the property. | Land | Improvement |
|---|---|---|---|---|
| 2025 | $5,780 | $236,922 | $63,846 | $173,076 |
| 2024 | $5,780 | $248,788 | $73,501 | $175,287 |
| 2023 | $5,021 | $221,633 | $43,804 | $177,829 |
| 2022 | $5,320 | $223,922 | $45,159 | $178,763 |
| 2021 | $4,059 | $160,929 | $23,774 | $137,155 |
| 2020 | $3,718 | $140,936 | $17,545 | $123,391 |
| 2019 | $3,695 | $134,281 | $11,835 | $122,446 |
| 2018 | $3,322 | $119,745 | $10,070 | $109,675 |
| 2017 | $2,794 | $99,859 | $4,153 | $95,706 |
| 2016 | $2,253 | $80,530 | $3,737 | $76,793 |
| 2015 | $0 | $84,708 | $4,568 | $80,140 |
| 2014 | -- | $84,708 | $4,568 | $80,140 |
Source: Public Records
Map
Nearby Homes
- 702 S Barrett Ave
- 621 W Munson St
- 511 W Munson St
- 701 W Hull St Unit 101-2
- 430 W Munson St
- 408 W Day St
- 704 W Hull St
- 830 W Shepherd St
- 615 W Texas St
- 513 W Texas St
- 326 W Day St
- 901 W Munson St
- 904 W Shepherd St
- 1011 S Armstrong Ave
- 708 W Texas St
- 919 W Day St
- 609 W Owing St
- 330 W Morgan St
- TBD W Texas St
- 1401 W Texas St