Estimated Value: $52,000 - $147,000
3
Beds
2
Baths
1,470
Sq Ft
$71/Sq Ft
Est. Value
About This Home
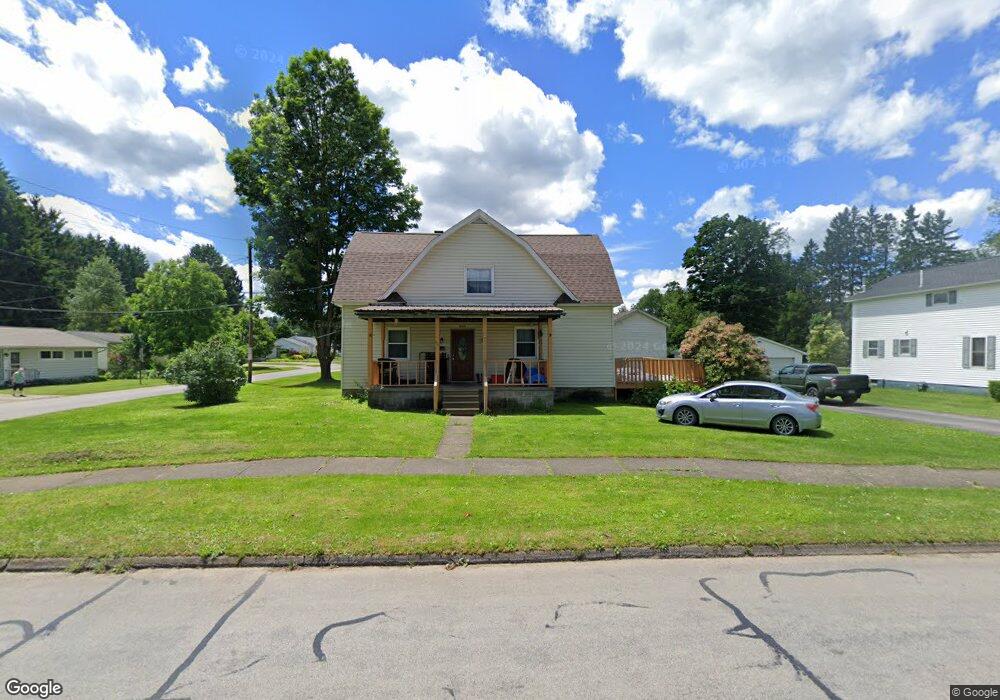
This home is located at 605 Wayne St, Corry, PA 16407 and is currently estimated at $104,130, approximately $70 per square foot. 605 Wayne St is a home located in Erie County with nearby schools including Corry Area Primary School, Corry Area Intermediate School, and Corry Area Middle School.
Ownership History
Date
Name
Owned For
Owner Type
Purchase Details
Closed on
Jul 14, 2020
Sold by
May James A and May Tonia E
Bought by
May James T
Current Estimated Value
Home Financials for this Owner
Home Financials are based on the most recent Mortgage that was taken out on this home.
Original Mortgage
$35,000
Outstanding Balance
$31,036
Interest Rate
3.1%
Mortgage Type
Unknown
Estimated Equity
$73,094
Purchase Details
Closed on
Apr 5, 2004
Sold by
Hud
Bought by
Chase Manhattan Mortgage Corp
Purchase Details
Closed on
Jan 16, 2004
Sold by
Herdman Frank G and Herdman Lynnae K
Bought by
Hud
Purchase Details
Closed on
Mar 4, 1997
Sold by
Staples Brian M and Staples Sally M
Bought by
Herdman Frank G
Create a Home Valuation Report for This Property
The Home Valuation Report is an in-depth analysis detailing your home's value as well as a comparison with similar homes in the area
Home Values in the Area
Average Home Value in this Area
Purchase History
| Date | Buyer | Sale Price | Title Company |
|---|---|---|---|
| May James T | $35,000 | None Available | |
| Chase Manhattan Mortgage Corp | -- | -- | |
| Hud | $1,463 | -- | |
| Herdman Frank G | $50,000 | -- |
Source: Public Records
Mortgage History
| Date | Status | Borrower | Loan Amount |
|---|---|---|---|
| Open | May James T | $35,000 |
Source: Public Records
Tax History
| Year | Tax Paid | Tax Assessment Tax Assessment Total Assessment is a certain percentage of the fair market value that is determined by local assessors to be the total taxable value of land and additions on the property. | Land | Improvement |
|---|---|---|---|---|
| 2025 | $2,041 | $62,400 | $14,100 | $48,300 |
| 2024 | $2,027 | $62,400 | $14,100 | $48,300 |
| 2023 | $1,978 | $62,400 | $14,100 | $48,300 |
| 2022 | $1,940 | $62,400 | $14,100 | $48,300 |
| 2021 | $1,926 | $62,400 | $14,100 | $48,300 |
| 2020 | $1,911 | $62,400 | $14,100 | $48,300 |
| 2019 | $1,880 | $62,400 | $14,100 | $48,300 |
| 2018 | $1,855 | $62,400 | $14,100 | $48,300 |
| 2017 | $1,823 | $62,400 | $14,100 | $48,300 |
| 2016 | $1,804 | $62,400 | $14,100 | $48,300 |
| 2015 | $1,788 | $62,400 | $14,100 | $48,300 |
| 2014 | $681 | $62,400 | $14,100 | $48,300 |
Source: Public Records
Map
Nearby Homes
- 549 Wayne St
- 1026 N Center St
- 535 Wright St
- 837 Us Highway 6
- 27 W Frederick St
- 820 Mead Ave
- 629 Mead Ave
- 1249 White St
- 515 Catherine St
- 110-118 W Smith and 307 Grace St
- 132 Random Rd
- 671 E Columbus Ave
- 533 E South St
- 259 Seminole Ave
- 219 Summer St
- 318 Worth St
- 425 E Pleasant St
- 433 E Pleasant St
- 257 Worth St
- 48 W Pleasant St
Your Personal Tour Guide
Ask me questions while you tour the home.