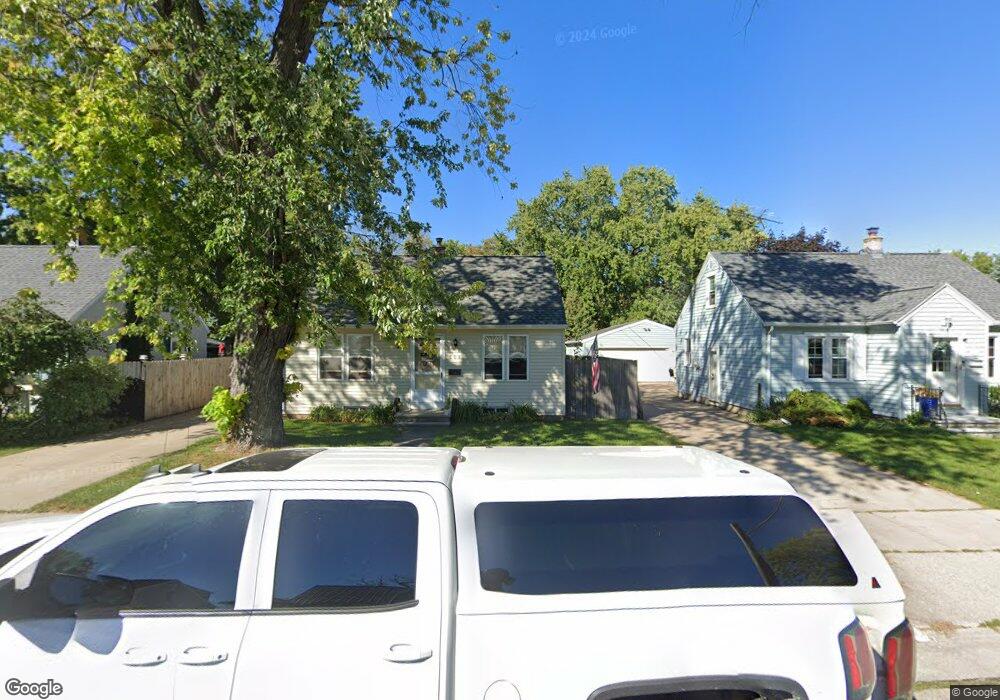
605 Wilson St Neenah, WI 54956
Estimated Value: $203,000 - $230,000
3
Beds
1
Bath
1,832
Sq Ft
$120/Sq Ft
Est. Value
About This Home
This home is located at 605 Wilson St, Neenah, WI 54956 and is currently estimated at $220,380, approximately $120 per square foot. 605 Wilson St is a home located in Winnebago County with nearby schools including Hoover Elementary School, Horace Mann Middle School, and Neenah Middle School.
Ownership History
Date
Name
Owned For
Owner Type
Purchase Details
Closed on
Feb 1, 2017
Sold by
Krier S Construction Llc
Bought by
Krier Charles J and Krier Laura A
Current Estimated Value
Purchase Details
Closed on
May 17, 2013
Sold by
Dyer Investments Llc
Bought by
Kriers Construction Llc
Home Financials for this Owner
Home Financials are based on the most recent Mortgage that was taken out on this home.
Original Mortgage
$102,000
Interest Rate
3.39%
Mortgage Type
Purchase Money Mortgage
Purchase Details
Closed on
May 31, 2005
Sold by
Leinweber Richard J and Leinweber Judith M
Bought by
Co Dyer Investments Llc
Home Financials for this Owner
Home Financials are based on the most recent Mortgage that was taken out on this home.
Original Mortgage
$95,520
Interest Rate
5.82%
Mortgage Type
Purchase Money Mortgage
Create a Home Valuation Report for This Property
The Home Valuation Report is an in-depth analysis detailing your home's value as well as a comparison with similar homes in the area
Home Values in the Area
Average Home Value in this Area
Purchase History
| Date | Buyer | Sale Price | Title Company |
|---|---|---|---|
| Krier Charles J | -- | None Available | |
| Kriers Construction Llc | $81,000 | None Available | |
| Co Dyer Investments Llc | $112,000 | None Available |
Source: Public Records
Mortgage History
| Date | Status | Borrower | Loan Amount |
|---|---|---|---|
| Previous Owner | Kriers Construction Llc | $102,000 | |
| Previous Owner | Co Dyer Investments Llc | $95,520 |
Source: Public Records
Tax History Compared to Growth
Tax History
| Year | Tax Paid | Tax Assessment Tax Assessment Total Assessment is a certain percentage of the fair market value that is determined by local assessors to be the total taxable value of land and additions on the property. | Land | Improvement |
|---|---|---|---|---|
| 2024 | $2,385 | $128,000 | $34,200 | $93,800 |
| 2023 | $3,246 | $108,500 | $32,800 | $75,700 |
| 2022 | $3,148 | $118,700 | $24,000 | $94,700 |
| 2021 | $2,945 | $118,700 | $24,000 | $94,700 |
| 2020 | $2,383 | $118,700 | $24,000 | $94,700 |
| 2019 | $2,720 | $118,700 | $24,000 | $94,700 |
| 2018 | $2,657 | $92,200 | $19,600 | $72,600 |
| 2017 | $2,690 | $92,200 | $19,600 | $72,600 |
| 2016 | $2,746 | $92,200 | $19,600 | $72,600 |
| 2015 | $2,742 | $108,500 | $32,800 | $75,700 |
| 2014 | $2,695 | $108,500 | $32,800 | $75,700 |
| 2013 | $3,520 | $108,500 | $32,800 | $75,700 |
Source: Public Records
Map
Nearby Homes
- 1301 Harrison St
- 631 Mckinley St
- 639 Mckinley St
- 624 Jackson St
- 743 Madison St
- 791 W Winneconne Ave
- 856 Riverlawn St
- 140 W Cecil St
- 125 W Cecil St
- 964 Hickory Ln
- 145 Langley Blvd
- 949 Higgins Ave
- 401 Van St
- 136 Langley Blvd Unit 138
- 942 Adams St
- 0 Greenfield St
- 0 S Western Ave
- 419 S Church St
- 1228 Cameron Cir Unit 82
- 210 W Peckham St
- 601 Wilson St
- 609 Wilson St
- 613 Wilson St
- 612 Roosevelt St
- 616 Roosevelt St
- 610 Roosevelt St
- 617 Wilson St
- 1211 Harrison St
- 1223 Harrison St
- 1205 Harrison St
- 623 Wilson St
- 1305 Harrison St
- 612 Wilson St
- 616 Wilson St
- 1201 Harrison St
- 618 Wilson St
- 628 Roosevelt St
- 625 Wilson St
- 624 Roosevelt St
- 624 Roosevelt St