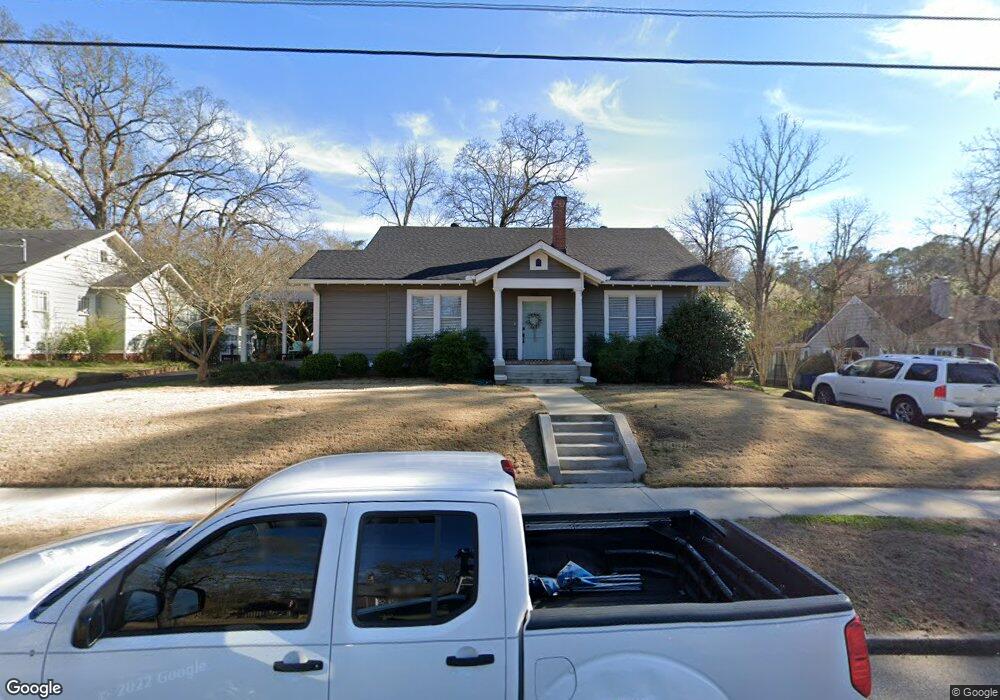
605 Winzor Ave Lagrange, GA 30240
Estimated Value: $244,905 - $345,000
3
Beds
1
Bath
1,652
Sq Ft
$177/Sq Ft
Est. Value
About This Home
This home is located at 605 Winzor Ave, Lagrange, GA 30240 and is currently estimated at $291,726, approximately $176 per square foot. 605 Winzor Ave is a home located in Troup County with nearby schools including Hollis Hand Elementary School, Ethel W. Kight Elementary School, and Franklin Forest Elementary School.
Ownership History
Date
Name
Owned For
Owner Type
Purchase Details
Closed on
Mar 5, 2007
Sold by
Holle Anita C
Bought by
Knowles Lemmo Destin M
Current Estimated Value
Home Financials for this Owner
Home Financials are based on the most recent Mortgage that was taken out on this home.
Original Mortgage
$158,796
Outstanding Balance
$94,888
Interest Rate
6.3%
Mortgage Type
New Conventional
Estimated Equity
$196,838
Purchase Details
Closed on
Jan 6, 2006
Sold by
Boner Marion C
Bought by
Holle Anita C
Purchase Details
Closed on
Aug 6, 1974
Sold by
Mrs Hariett C Dorsey
Bought by
Marion C Boner
Purchase Details
Closed on
Nov 1, 1970
Sold by
Catherine T Benninghoff
Bought by
Mrs Hariett C Dorsey
Purchase Details
Closed on
Jan 1, 1969
Sold by
Wallace Keeble
Bought by
Catherine T Benninghoff
Purchase Details
Closed on
Jan 1, 1960
Sold by
Walter L Finney
Bought by
Wallace Keeble
Create a Home Valuation Report for This Property
The Home Valuation Report is an in-depth analysis detailing your home's value as well as a comparison with similar homes in the area
Purchase History
| Date | Buyer | Sale Price | Title Company |
|---|---|---|---|
| Knowles Lemmo Destin M | $160,100 | -- | |
| Holle Anita C | $106,000 | -- | |
| Marion C Boner | $33,300 | -- | |
| Mrs Hariett C Dorsey | -- | -- | |
| Catherine T Benninghoff | -- | -- | |
| Wallace Keeble | -- | -- |
Source: Public Records
Mortgage History
| Date | Status | Borrower | Loan Amount |
|---|---|---|---|
| Open | Knowles Lemmo Destin M | $158,796 |
Source: Public Records
Tax History
| Year | Tax Paid | Tax Assessment Tax Assessment Total Assessment is a certain percentage of the fair market value that is determined by local assessors to be the total taxable value of land and additions on the property. | Land | Improvement |
|---|---|---|---|---|
| 2025 | $2,166 | $84,080 | $18,000 | $66,080 |
| 2024 | $2,034 | $76,560 | $18,000 | $58,560 |
| 2023 | $1,892 | $71,360 | $18,000 | $53,360 |
| 2022 | $1,727 | $63,880 | $14,000 | $49,880 |
| 2021 | $1,478 | $51,000 | $8,560 | $42,440 |
| 2020 | $1,478 | $51,000 | $8,560 | $42,440 |
| 2019 | $1,099 | $38,440 | $7,880 | $30,560 |
| 2018 | $1,056 | $37,000 | $7,880 | $29,120 |
| 2017 | $940 | $33,160 | $7,360 | $25,800 |
| 2016 | $932 | $32,877 | $7,360 | $25,517 |
| 2015 | $950 | $33,407 | $7,890 | $25,517 |
| 2014 | $935 | $32,881 | $7,890 | $24,991 |
| 2013 | -- | $35,855 | $7,876 | $27,979 |
Source: Public Records
Map
Nearby Homes
- 203 Waverly Way
- 450 Gordon Cir
- 705 Piney Woods Dr
- 420 Ridgecrest Rd
- 206 Broad St
- 119 College Ave
- 208 Boulevard
- 405 W Broome St Unit 2
- 405 W Broome St Unit 3
- 405 W Broome St Unit 4
- 405 W Broome St Unit 1
- 405 W Broome St Unit 5
- 403 College Ave
- 222 Beechwood Cir
- 304 Boulevard
- 118 Highland Ave
- 609 Ridley Ave
- 707 Ridley Ave
- 611 Ridley Ave
- 615 Ridley Ave
- 607 Winzor Ave
- 603 Winzor Ave
- 609 Winzor Ave
- 601 Winzor Ave
- 608 Virginia Ave
- 604 Virginia Ave
- 606 Winzor Ave
- 606 Virginia Ave
- 604 Winzor Ave
- 602 Virginia Ave
- 610 Virginia Ave
- 608 Winzor Ave
- 310 Waverly Way
- 312 Waverly Way
- 610 Winzor Ave
- 407 Springdale Dr Unit A
- 407 Springdale Dr
- 612 Virginia Ave
- 409 Springdale Dr
- 600 Winzor Ave
Your Personal Tour Guide
Ask me questions while you tour the home.