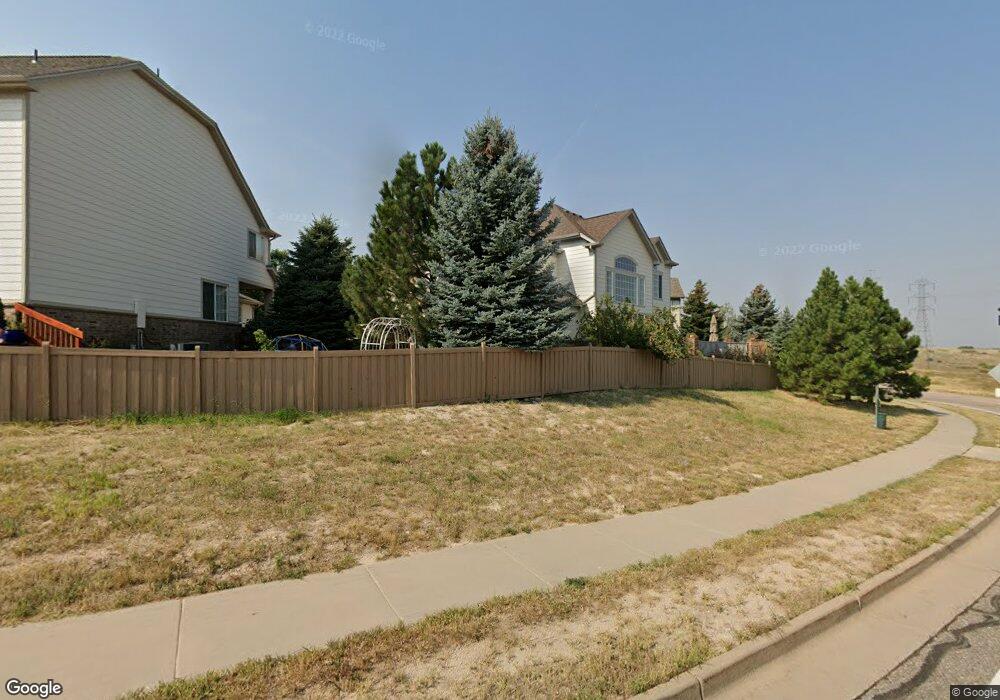
6051 Blue Terrace Place Castle Pines, CO 80108
Estimated Value: $793,580 - $921,000
4
Beds
3
Baths
2,656
Sq Ft
$324/Sq Ft
Est. Value
About This Home
This home is located at 6051 Blue Terrace Place, Castle Pines, CO 80108 and is currently estimated at $861,145, approximately $324 per square foot. 6051 Blue Terrace Place is a home located in Douglas County with nearby schools including Timber Trail Elementary School, Rocky Heights Middle School, and Rock Canyon High School.
Ownership History
Date
Name
Owned For
Owner Type
Purchase Details
Closed on
Nov 22, 2024
Sold by
Ng Boon Long
Bought by
6051 Blue Terrace Llc
Current Estimated Value
Purchase Details
Closed on
Jun 6, 2024
Sold by
6051 Blue Terrace Llc
Bought by
Ng Boon-Long
Purchase Details
Closed on
Jan 13, 2021
Sold by
Ng Boon Long and Chau Wing Yu
Bought by
6051 Blue Terrace Llc
Purchase Details
Closed on
Dec 5, 2003
Sold by
Pulte Home Corp
Bought by
Ng Boon Long and Chau Wing Yu
Home Financials for this Owner
Home Financials are based on the most recent Mortgage that was taken out on this home.
Original Mortgage
$295,489
Interest Rate
5.12%
Mortgage Type
Unknown
Purchase Details
Closed on
Apr 21, 2000
Sold by
Cpn Investors
Bought by
Mirage Romar
Create a Home Valuation Report for This Property
The Home Valuation Report is an in-depth analysis detailing your home's value as well as a comparison with similar homes in the area
Home Values in the Area
Average Home Value in this Area
Purchase History
| Date | Buyer | Sale Price | Title Company |
|---|---|---|---|
| 6051 Blue Terrace Llc | -- | None Listed On Document | |
| 6051 Blue Terrace Llc | -- | None Listed On Document | |
| Ng Boon-Long | -- | None Listed On Document | |
| 6051 Blue Terrace Llc | -- | None Available | |
| Ng Boon Long | $369,362 | Land Title | |
| Mirage Romar | $9,750,000 | -- |
Source: Public Records
Mortgage History
| Date | Status | Borrower | Loan Amount |
|---|---|---|---|
| Previous Owner | Ng Boon Long | $295,489 | |
| Closed | Ng Boon Long | $55,404 |
Source: Public Records
Tax History Compared to Growth
Tax History
| Year | Tax Paid | Tax Assessment Tax Assessment Total Assessment is a certain percentage of the fair market value that is determined by local assessors to be the total taxable value of land and additions on the property. | Land | Improvement |
|---|---|---|---|---|
| 2024 | $4,820 | $52,600 | $10,000 | $42,600 |
| 2023 | $4,866 | $52,600 | $10,000 | $42,600 |
| 2022 | $3,717 | $38,740 | $7,110 | $31,630 |
| 2021 | $3,864 | $38,740 | $7,110 | $31,630 |
| 2020 | $3,903 | $38,820 | $5,580 | $33,240 |
| 2019 | $3,916 | $38,820 | $5,580 | $33,240 |
| 2018 | $3,462 | $33,840 | $7,430 | $26,410 |
| 2017 | $3,252 | $36,030 | $7,430 | $28,600 |
| 2016 | $3,864 | $35,310 | $8,360 | $26,950 |
| 2015 | $4,297 | $35,310 | $8,360 | $26,950 |
| 2014 | $3,805 | $29,820 | $7,560 | $22,260 |
Source: Public Records
Map
Nearby Homes
- 12350 Turquoise Terrace St
- 6450 Montano Place
- 12370 Tapadero Way
- 6523 Tapadero Place
- 6047 Vacquero Cir
- 6561 Ocaso Dr
- 6743 Serena Ave
- 5810 Amber Ridge Dr
- 6577 Esperanza Dr
- 7086 Esperanza Dr
- 7224 Serena Dr
- 7257 Arco Iris Ln
- 8424 Winter Berry Dr
- 12926 Horizon Trail
- 983 Bramblewood Dr
- 1232 Berganot Trail
- 860 Bramblewood Dr
- 1229 Berganot Trail
- 8133 Spikegrass Ct
- 8467 Brambleridge Dr
- 6029 Blue Terrace Place
- 6075 Blue Terrace Place
- 6015 Blue Terrace Place
- 6078 Blue Terrace Place
- 6050 Blue Terrace Place
- 6022 Blue Terrace Place
- 12332 Turquoise Terrace St
- 12351 Blue Terrace Way
- 6047 Blue Terrace Cir
- 12345 Blue Terrace Way
- 12359 Blue Terrace Way
- 6025 Blue Terrace Cir
- 12335 Turquoise Terrace St
- 6071 Blue Terrace Cir
- 12367 Blue Terrace Way
- 12375 Blue Terrace Way
- 12338 Turquoise Terrace St
- 6095 Blue Terrace Cir
- 12349 Turquoise Terrace St
- 12385 Blue Terrace Way