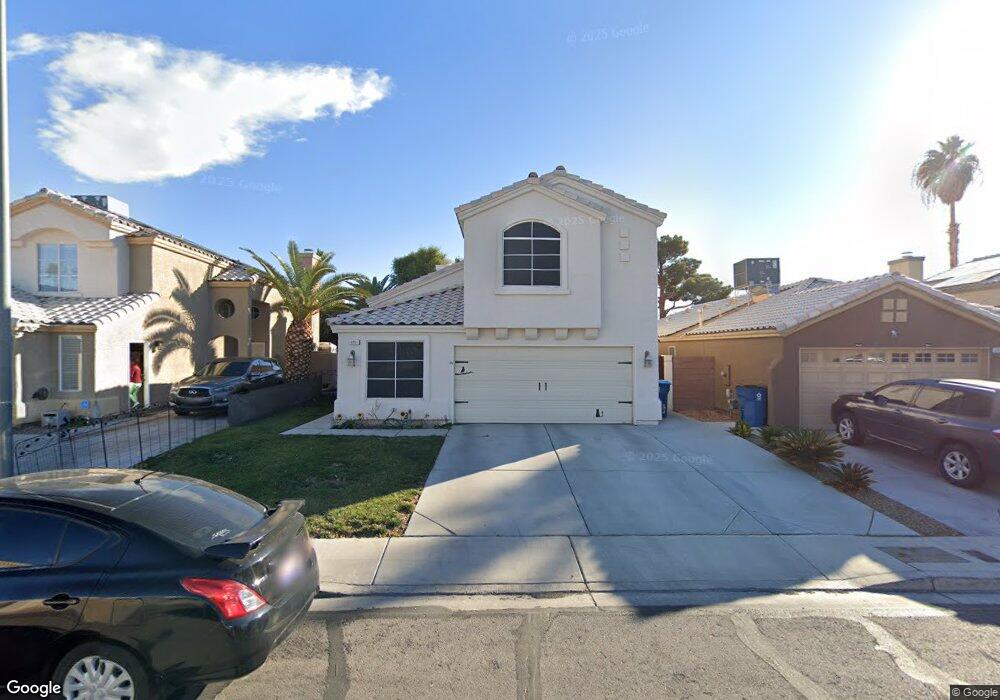
6051 Flowering Plum Ave Las Vegas, NV 89142
Estimated Value: $394,011 - $433,000
4
Beds
3
Baths
1,740
Sq Ft
$237/Sq Ft
Est. Value
About This Home
This home is located at 6051 Flowering Plum Ave, Las Vegas, NV 89142 and is currently estimated at $413,003, approximately $237 per square foot. 6051 Flowering Plum Ave is a home located in Clark County with nearby schools including Dan Goldfarb Elementary School, Kathleen & Tim Harney Middle School, and Las Vegas High School.
Ownership History
Date
Name
Owned For
Owner Type
Purchase Details
Closed on
Jun 2, 2022
Sold by
Kovacs Tammi S
Bought by
Tammi S Kovacs Separate Property Trust
Current Estimated Value
Purchase Details
Closed on
Nov 25, 2002
Sold by
Sharp Walter H and Sharp Dawn L
Bought by
Kovacs Tammi S
Home Financials for this Owner
Home Financials are based on the most recent Mortgage that was taken out on this home.
Original Mortgage
$78,000
Interest Rate
5.89%
Purchase Details
Closed on
Jan 4, 1994
Sold by
Lewis Properties
Bought by
Sharp Walter H and Sharp Dawn L
Home Financials for this Owner
Home Financials are based on the most recent Mortgage that was taken out on this home.
Original Mortgage
$109,540
Interest Rate
7.16%
Mortgage Type
FHA
Create a Home Valuation Report for This Property
The Home Valuation Report is an in-depth analysis detailing your home's value as well as a comparison with similar homes in the area
Home Values in the Area
Average Home Value in this Area
Purchase History
| Date | Buyer | Sale Price | Title Company |
|---|---|---|---|
| Tammi S Kovacs Separate Property Trust | -- | Cassady Law Offices | |
| Kovacs Tammi S | -- | Cassady Law Offices | |
| Kovacs Tammi S | $163,000 | Land Title | |
| Sharp Walter H | $110,500 | Land Title |
Source: Public Records
Mortgage History
| Date | Status | Borrower | Loan Amount |
|---|---|---|---|
| Previous Owner | Kovacs Tammi S | $78,000 | |
| Previous Owner | Sharp Walter H | $109,540 |
Source: Public Records
Tax History Compared to Growth
Tax History
| Year | Tax Paid | Tax Assessment Tax Assessment Total Assessment is a certain percentage of the fair market value that is determined by local assessors to be the total taxable value of land and additions on the property. | Land | Improvement |
|---|---|---|---|---|
| 2025 | $1,179 | $79,629 | $24,850 | $54,779 |
| 2024 | $1,145 | $79,629 | $24,850 | $54,779 |
| 2023 | $1,145 | $81,001 | $28,700 | $52,301 |
| 2022 | $1,112 | $71,512 | $23,450 | $48,062 |
| 2021 | $1,079 | $67,255 | $21,350 | $45,905 |
| 2020 | $1,045 | $66,292 | $20,650 | $45,642 |
| 2019 | $1,015 | $63,035 | $17,850 | $45,185 |
| 2018 | $985 | $57,430 | $13,965 | $43,465 |
| 2017 | $1,687 | $57,506 | $13,300 | $44,206 |
| 2016 | $934 | $47,699 | $9,450 | $38,249 |
| 2015 | $931 | $39,304 | $8,050 | $31,254 |
| 2014 | $904 | $31,773 | $7,000 | $24,773 |
Source: Public Records
Map
Nearby Homes
- 1291 Orange Meadow St
- 1259 Plum Canyon St
- 6053 Wild Berry Dr
- 6058 Grape Blossom Ave
- 1148 Orchard View St Unit 2
- 5913 Autumn Harvest Ave
- 6094 Bing Cherry Dr
- 6092 Golden Nectar Way
- 1747 Angel Falls St
- 1631 Mapleleaf St
- 1779 Pineapple Tree Ct
- 1346 Doucette Dr
- 1927 Raspberry Hill Rd
- 5794 Sea Breeze Ave
- 131 Beesley Dr
- 5849 Emerald Canyon Dr
- 1950 Turtlerock St
- 60 N Fogg St
- 6384 Cornstalk Cir
- 6311 American Beauty Ave
- 6061 Flowering Plum Ave
- 6067 Flowering Plum Ave
- 6035 Flowering Plum Ave
- 6056 Orange Hill Dr
- 6048 Orange Hill Dr
- 6062 Orange Hill Dr
- 6073 Flowering Plum Ave
- 6027 Flowering Plum Ave
- 6032 Orange Hill Dr
- 6048 Flowering Plum Ave
- 6038 Flowering Plum Ave
- 6066 Flowering Plum Ave
- 6079 Flowering Plum Ave
- 6024 Orange Hill Dr
- 6074 Orange Hill Dr
- 6030 Flowering Plum Ave
- 6017 Flowering Plum Ave
- 6072 Flowering Plum Ave
- 6080 Orange Hill Dr