Estimated Value: $419,013 - $538,000
--
Bed
3
Baths
2,533
Sq Ft
$184/Sq Ft
Est. Value
About This Home
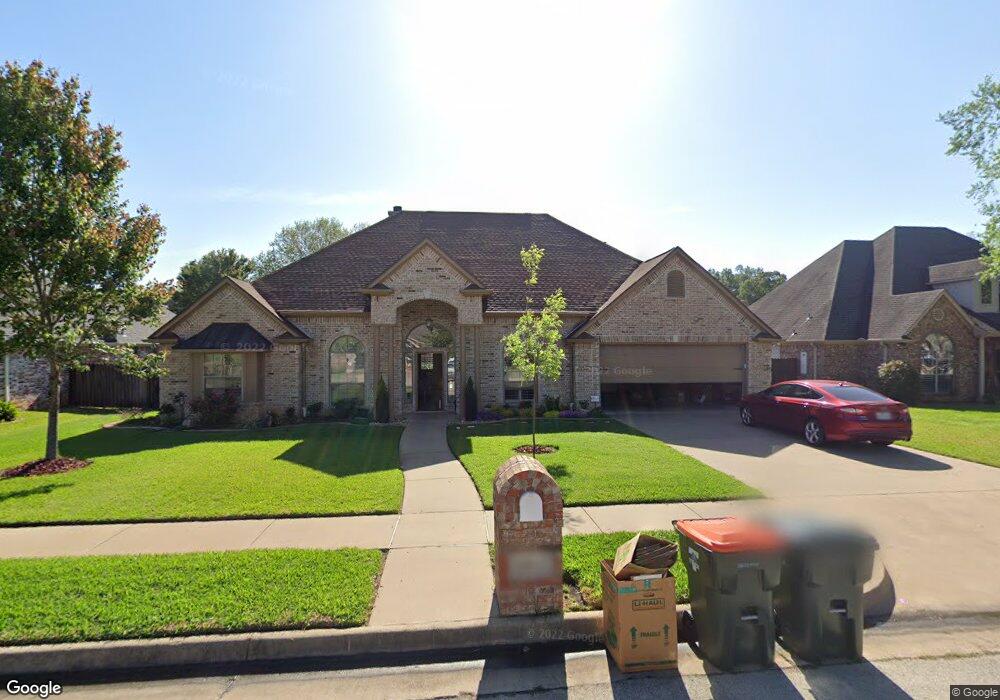
This home is located at 6052 Brynmar Ct, Tyler, TX 75703 and is currently estimated at $466,503, approximately $184 per square foot. 6052 Brynmar Ct is a home located in Smith County with nearby schools including Rice Elementary School, Hubbard Middle School, and Tyler Legacy High School.
Ownership History
Date
Name
Owned For
Owner Type
Purchase Details
Closed on
Sep 30, 2013
Sold by
Fu Jian and Liang Mei
Bought by
Klein Cynthia and Klein Wayde
Current Estimated Value
Home Financials for this Owner
Home Financials are based on the most recent Mortgage that was taken out on this home.
Original Mortgage
$229,500
Interest Rate
4.54%
Mortgage Type
New Conventional
Purchase Details
Closed on
Dec 14, 2005
Sold by
Mccaffrey Harold and Mccaffrey Rose A
Bought by
Fu Jian
Home Financials for this Owner
Home Financials are based on the most recent Mortgage that was taken out on this home.
Original Mortgage
$27,300
Interest Rate
6.3%
Mortgage Type
Purchase Money Mortgage
Purchase Details
Closed on
Apr 26, 2005
Sold by
Starr Capital Investments Ltd
Bought by
Mccaffrey Harold and Mccaffrey Rose A
Create a Home Valuation Report for This Property
The Home Valuation Report is an in-depth analysis detailing your home's value as well as a comparison with similar homes in the area
Home Values in the Area
Average Home Value in this Area
Purchase History
| Date | Buyer | Sale Price | Title Company |
|---|---|---|---|
| Klein Cynthia | -- | None Available | |
| Fu Jian | -- | None Available | |
| Mccaffrey Harold | -- | None Available |
Source: Public Records
Mortgage History
| Date | Status | Borrower | Loan Amount |
|---|---|---|---|
| Closed | Klein Cynthia | $229,500 | |
| Previous Owner | Fu Jian | $27,300 | |
| Previous Owner | Fu Jian | $218,400 |
Source: Public Records
Tax History Compared to Growth
Tax History
| Year | Tax Paid | Tax Assessment Tax Assessment Total Assessment is a certain percentage of the fair market value that is determined by local assessors to be the total taxable value of land and additions on the property. | Land | Improvement |
|---|---|---|---|---|
| 2025 | $5,721 | $438,892 | $42,972 | $395,920 |
| 2024 | $5,721 | $396,296 | $61,250 | $400,559 |
| 2023 | $6,280 | $418,295 | $61,250 | $357,045 |
| 2022 | $6,417 | $377,061 | $48,300 | $328,761 |
| 2021 | $6,247 | $297,743 | $48,300 | $249,443 |
| 2020 | $6,324 | $295,516 | $48,300 | $247,216 |
| 2019 | $7,226 | $330,448 | $35,000 | $295,448 |
| 2018 | $6,474 | $297,658 | $35,000 | $262,658 |
| 2017 | $6,355 | $297,658 | $35,000 | $262,658 |
| 2016 | $6,309 | $295,522 | $35,000 | $260,522 |
| 2015 | $5,837 | $284,511 | $35,000 | $249,511 |
| 2014 | $5,837 | $274,669 | $35,000 | $239,669 |
Source: Public Records
Map
Nearby Homes
- 5701 Plantation Dr
- 5829 Brynmar Ct
- 1869 Hollylake Cir
- 5803 Stoneleigh Dr
- 1915 Hollyglen Dr
- 5900 Stoneleigh Dr
- 5290 Tyler Park Dr
- 1212 Parkview Dr
- 5821 Cross Creek Cir
- 973 Creekside Dr
- 5401 Hollytree Dr
- 5401 Hollytree Dr Unit 1002
- 1202 Rice Rd
- 1408 Woodbridge Dr
- 716 Chimney Rock Dr
- 940 La Vista Dr
- 1521 Rice Rd
- 1521 Rice Rd Unit Z104
- 1521 Rice Rd Unit E105
- 6052 6052 Brynmar Ct
- 6056 6056 Brynmar Ct
- 6048 6048 Brynmar Ct
- 6056 Brynmar Ct
- 6048 Brynmar Ct
- 5805 Brynmar Ct
- 5801 5801 Brynmar Ct
- 5801 Brynmar Ct
- 5809 Brynmar Ct
- 6044 Brynmar Ct
- 6044 6044 Brynmar Ct
- 6057 Brynmar Ct
- 6057 6057 Brynmar Ct
- 6053 Brynmar Ct
- 5813 Brynmar Ct
- 6059 Brynmar Ct
- 6049 Brynmar Ct
- 6067 Brynmar Ct
- 5786 Brynmar Ct
- 6067 6067 Brynmar Ct