Estimated Value: $341,000 - $353,000
3
Beds
2
Baths
1,344
Sq Ft
$259/Sq Ft
Est. Value
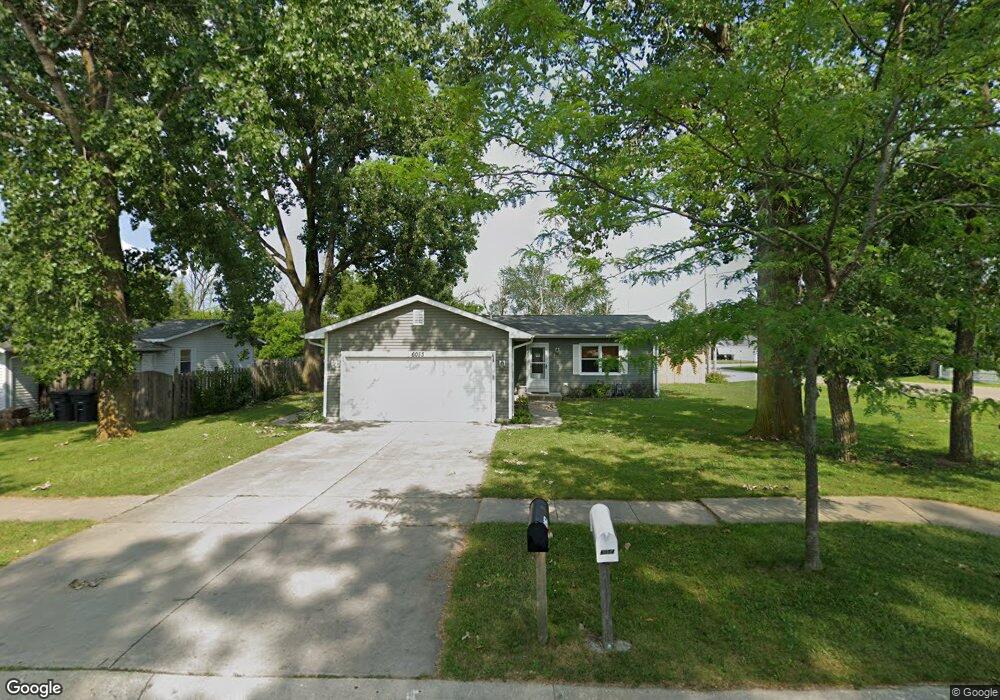
About This Home
This home is located at 6053 243rd Ct, Salem, WI 53168 and is currently estimated at $347,909, approximately $258 per square foot. 6053 243rd Ct is a home located in Kenosha County with nearby schools including Salem Elementary School and Central High School.
Ownership History
Date
Name
Owned For
Owner Type
Purchase Details
Closed on
Aug 11, 2017
Sold by
Madden Lucas
Bought by
Brickner Brian D and Merrill Amy L
Current Estimated Value
Home Financials for this Owner
Home Financials are based on the most recent Mortgage that was taken out on this home.
Original Mortgage
$212,121
Outstanding Balance
$177,332
Interest Rate
4.03%
Mortgage Type
New Conventional
Estimated Equity
$170,577
Purchase Details
Closed on
Jan 14, 2011
Sold by
Vento Donald
Bought by
Madden Lucas
Create a Home Valuation Report for This Property
The Home Valuation Report is an in-depth analysis detailing your home's value as well as a comparison with similar homes in the area
Home Values in the Area
Average Home Value in this Area
Purchase History
| Date | Buyer | Sale Price | Title Company |
|---|---|---|---|
| Brickner Brian D | $210,000 | -- | |
| Madden Lucas | $150,000 | -- |
Source: Public Records
Mortgage History
| Date | Status | Borrower | Loan Amount |
|---|---|---|---|
| Open | Brickner Brian D | $212,121 |
Source: Public Records
Tax History Compared to Growth
Tax History
| Year | Tax Paid | Tax Assessment Tax Assessment Total Assessment is a certain percentage of the fair market value that is determined by local assessors to be the total taxable value of land and additions on the property. | Land | Improvement |
|---|---|---|---|---|
| 2024 | $4,417 | $310,500 | $37,500 | $273,000 |
| 2023 | $3,757 | $310,500 | $37,500 | $273,000 |
| 2022 | $4,433 | $262,000 | $28,000 | $234,000 |
| 2021 | $4,193 | $262,000 | $28,000 | $234,000 |
| 2020 | $4,193 | $210,500 | $20,500 | $190,000 |
| 2019 | $4,149 | $210,500 | $20,500 | $190,000 |
| 2018 | $4,831 | $210,500 | $20,500 | $190,000 |
| 2017 | $3,669 | $164,000 | $20,500 | $143,500 |
| 2016 | $4,288 | $164,000 | $20,500 | $143,500 |
| 2015 | $3,648 | $164,000 | $20,500 | $143,500 |
| 2014 | -- | $164,000 | $20,500 | $143,500 |
Source: Public Records
Map
Nearby Homes
- 6117 246th Ave
- Lt2 64th Place
- 24121 64th Place
- 24423 66th St
- 6800 243rd Ave
- 6504 235th Ave
- 6431 235th Ave
- 6605 236th Ave
- 6617 236th Ave
- 6811 236th Ave
- Lt82 72nd St
- Lot 83 72nd St
- Lt83 72nd St
- Lot 82 72nd St
- 24920 73rd St
- The Maxwell Plan at Whitetail Ridge
- The Springwood Plan at Whitetail Ridge
- The Carrington Plan at Whitetail Ridge
- The Wellington Plan at Whitetail Ridge
- The Ava Plan at Whitetail Ridge