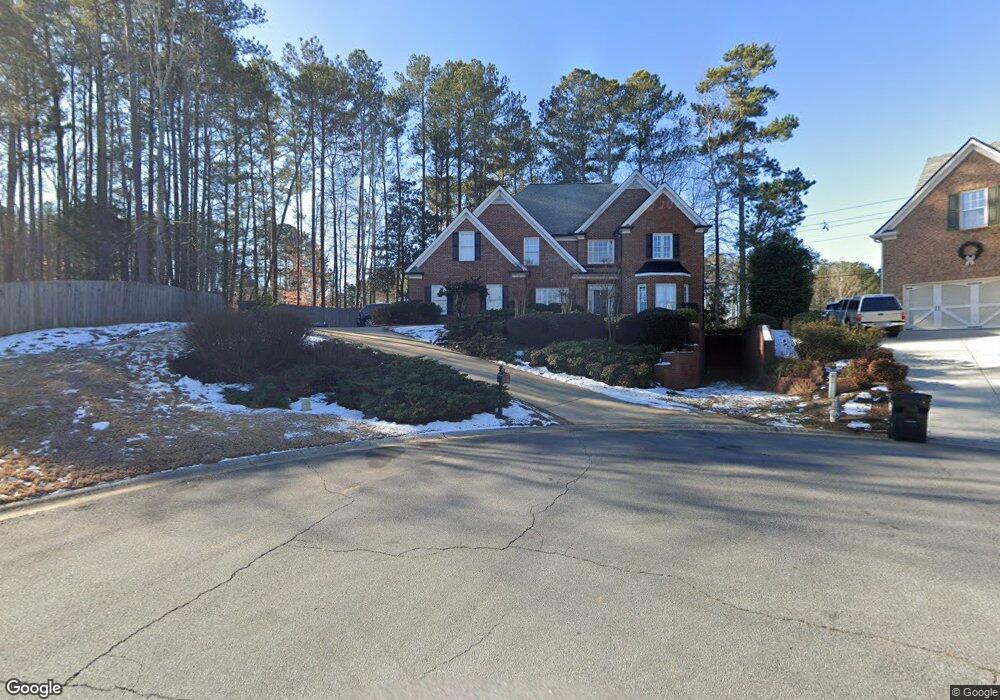
6053 Kenbrook Cir NW Unit XI Acworth, GA 30101
Estimated Value: $576,640 - $641,000
5
Beds
4
Baths
3,184
Sq Ft
$192/Sq Ft
Est. Value
About This Home
This home is located at 6053 Kenbrook Cir NW Unit XI, Acworth, GA 30101 and is currently estimated at $612,160, approximately $192 per square foot. 6053 Kenbrook Cir NW Unit XI is a home located in Cobb County with nearby schools including Ford Elementary School, Durham Middle School, and Harrison High School.
Ownership History
Date
Name
Owned For
Owner Type
Purchase Details
Closed on
Apr 30, 1999
Sold by
Byndloss Steven J
Bought by
Byndloss Steven J and Byndloss Cecelia M
Current Estimated Value
Home Financials for this Owner
Home Financials are based on the most recent Mortgage that was taken out on this home.
Original Mortgage
$221,000
Outstanding Balance
$55,682
Interest Rate
6.98%
Mortgage Type
New Conventional
Estimated Equity
$556,478
Purchase Details
Closed on
Nov 21, 1995
Sold by
Charter B T Co
Bought by
Byndloss Steven J Cecelia
Purchase Details
Closed on
Aug 24, 1994
Sold by
Willoughby Sewell Dev Ltd
Bought by
Chastain Bldrs Inc
Home Financials for this Owner
Home Financials are based on the most recent Mortgage that was taken out on this home.
Original Mortgage
$153,825
Interest Rate
8.74%
Mortgage Type
Construction
Create a Home Valuation Report for This Property
The Home Valuation Report is an in-depth analysis detailing your home's value as well as a comparison with similar homes in the area
Home Values in the Area
Average Home Value in this Area
Purchase History
| Date | Buyer | Sale Price | Title Company |
|---|---|---|---|
| Byndloss Steven J | -- | -- | |
| Byndloss Steven J Cecelia | $219,100 | -- | |
| Chastain Bldrs Inc | $43,900 | -- |
Source: Public Records
Mortgage History
| Date | Status | Borrower | Loan Amount |
|---|---|---|---|
| Open | Byndloss Steven J | $221,000 | |
| Previous Owner | Chastain Bldrs Inc | $153,825 |
Source: Public Records
Tax History Compared to Growth
Tax History
| Year | Tax Paid | Tax Assessment Tax Assessment Total Assessment is a certain percentage of the fair market value that is determined by local assessors to be the total taxable value of land and additions on the property. | Land | Improvement |
|---|---|---|---|---|
| 2025 | $1,374 | $231,660 | $60,000 | $171,660 |
| 2024 | $1,437 | $250,928 | $60,000 | $190,928 |
| 2023 | $1,052 | $191,120 | $26,000 | $165,120 |
| 2022 | $1,258 | $191,120 | $26,000 | $165,120 |
| 2021 | $1,144 | $152,988 | $26,000 | $126,988 |
| 2020 | $1,089 | $134,588 | $26,000 | $108,588 |
| 2019 | $1,089 | $134,588 | $26,000 | $108,588 |
| 2018 | $3,221 | $124,424 | $26,000 | $98,424 |
| 2017 | $3,096 | $124,424 | $26,000 | $98,424 |
| 2016 | $2,943 | $117,340 | $24,800 | $92,540 |
| 2015 | $3,149 | $123,572 | $23,200 | $100,372 |
| 2014 | $3,171 | $123,572 | $0 | $0 |
Source: Public Records
Map
Nearby Homes
- 5830 Brookstone Walk NW
- 1707 Kenbrook Ct NW
- 5881 Brookstone Walk NW
- 1391 Benbrooke Ln NW
- 1382 Benbrooke Ln NW
- 6065 Victoria Falls Overlook NW
- 002 Knob Creek Ct NW
- 1670 Knob Creek Ct NW
- 5807 Brookstone Walk NW
- The Brooks Plan at Woodford
- The Pinehurst Plan at Woodford
- The Vinings Plan at Woodford
- The Evans Plan at Woodford
- The Rebecca Plan at Woodford
- The Bainbridge Plan at Woodford
- The Thomson Plan at Woodford
- The Dillard Plan at Woodford
- The Ashburn Plan at Woodford
- The Oxford Plan at Woodford
- 001 Amber Glow Ln NW
- 6052 Kenbrook Cir NW
- 6051 Kenbrook Cir NW
- 6050 Kenbrook Cir NW
- 0 Kenbrook Cir NW Unit 7254267
- 0 Kenbrook Cir NW Unit 8573977
- 0 Kenbrook Cir NW
- 5851 Brookstone Walk NW
- 5857 Brookstone Walk NW
- 1446 County Line Rd NW
- 1446 County Line Road Nw 0
- 5854 Brookstone Walk NW
- 1601 Fernstone Dr NW
- 5859 Brookstone Walk NW
- 5856 Brookstone Walk NW Unit XI
- 5856 Brookstone Walk NW
- 5850 Brookstone Walk NW
- 5852 Brookstone Walk NW
- 1426 Beechworth Ln
- 1426 Beechworth Ln
- 5858 Brookstone Walk NW