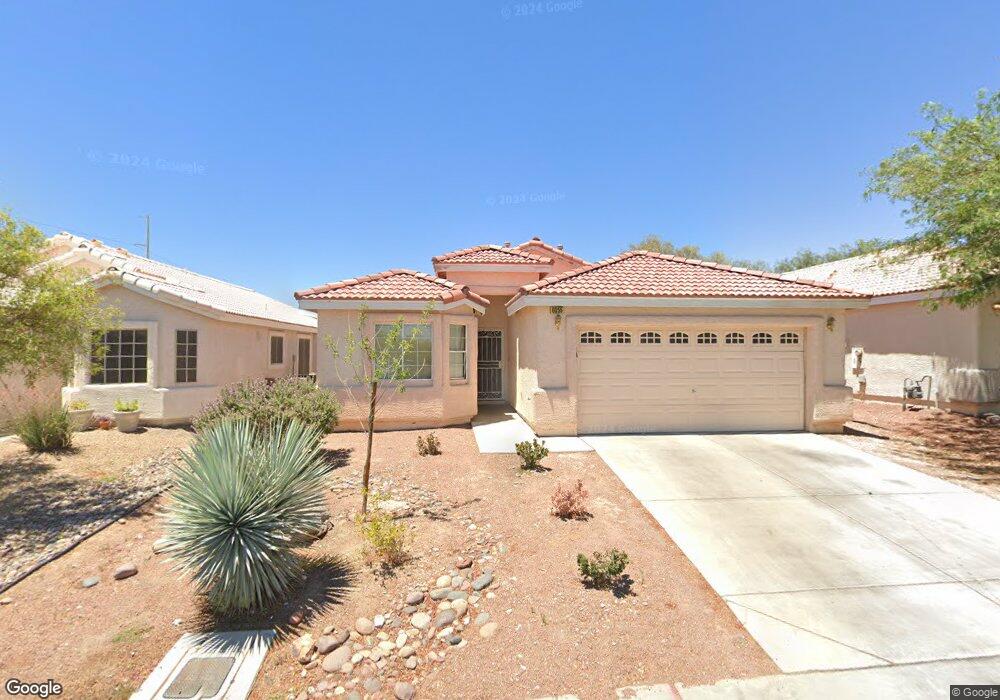
6055 Camden Cove St North Las Vegas, NV 89081
Northridge NeighborhoodEstimated Value: $404,001 - $421,000
4
Beds
2
Baths
1,912
Sq Ft
$216/Sq Ft
Est. Value
About This Home
This home is located at 6055 Camden Cove St, North Las Vegas, NV 89081 and is currently estimated at $413,750, approximately $216 per square foot. 6055 Camden Cove St is a home located in Clark County with nearby schools including John Tartan Elementary School, Carroll M. Johnston STEM Academy of Environmental Studies, and Clifford O. Findlay Middle School.
Ownership History
Date
Name
Owned For
Owner Type
Purchase Details
Closed on
Mar 19, 2012
Sold by
The Bank Of New York Mellon
Bought by
Partush Shlomo
Current Estimated Value
Purchase Details
Closed on
Aug 22, 2011
Sold by
Baldonado Rex
Bought by
The Bank Of New York Mellon and The Bank Of New York
Purchase Details
Closed on
Aug 30, 2005
Sold by
D R Horton Inc
Bought by
Baldonado Rex
Home Financials for this Owner
Home Financials are based on the most recent Mortgage that was taken out on this home.
Original Mortgage
$265,364
Interest Rate
5.64%
Mortgage Type
Fannie Mae Freddie Mac
Purchase Details
Closed on
Aug 29, 2005
Sold by
Baldonado Evelyn
Bought by
Baldonado Rex
Home Financials for this Owner
Home Financials are based on the most recent Mortgage that was taken out on this home.
Original Mortgage
$265,364
Interest Rate
5.64%
Mortgage Type
Fannie Mae Freddie Mac
Purchase Details
Closed on
Apr 15, 2005
Sold by
Us Home Corp
Bought by
D R Horton Inc
Create a Home Valuation Report for This Property
The Home Valuation Report is an in-depth analysis detailing your home's value as well as a comparison with similar homes in the area
Home Values in the Area
Average Home Value in this Area
Purchase History
| Date | Buyer | Sale Price | Title Company |
|---|---|---|---|
| Partush Shlomo | $88,000 | Fidelity Rainbow | |
| The Bank Of New York Mellon | $107,910 | Accommodation | |
| Baldonado Rex | $318,835 | Dhi Title | |
| Baldonado Rex | -- | Dhi Title | |
| D R Horton Inc | -- | North American Title Co |
Source: Public Records
Mortgage History
| Date | Status | Borrower | Loan Amount |
|---|---|---|---|
| Previous Owner | Baldonado Rex | $265,364 |
Source: Public Records
Tax History Compared to Growth
Tax History
| Year | Tax Paid | Tax Assessment Tax Assessment Total Assessment is a certain percentage of the fair market value that is determined by local assessors to be the total taxable value of land and additions on the property. | Land | Improvement |
|---|---|---|---|---|
| 2025 | $2,054 | $119,445 | $32,200 | $87,245 |
| 2024 | $1,902 | $119,445 | $32,200 | $87,245 |
| 2023 | $1,902 | $114,489 | $32,200 | $82,289 |
| 2022 | $1,761 | $99,996 | $24,850 | $75,146 |
| 2021 | $1,631 | $95,095 | $23,800 | $71,295 |
| 2020 | $1,512 | $92,642 | $22,050 | $70,592 |
| 2019 | $1,417 | $88,310 | $18,900 | $69,410 |
| 2018 | $1,352 | $78,303 | $15,050 | $63,253 |
| 2017 | $2,275 | $67,712 | $13,300 | $54,412 |
| 2016 | $1,266 | $59,662 | $10,850 | $48,812 |
| 2015 | $1,263 | $47,245 | $7,700 | $39,545 |
| 2014 | $1,224 | $35,275 | $5,600 | $29,675 |
Source: Public Records
Map
Nearby Homes
- 2650 Dahlia Falls Ave
- 2650 Dahlia Falls Ave Unit 126
- 2646 Dahlia Falls Ave Unit 125
- 2771 Alderly Ridge Ave
- 1865 Plan at Kalea Bay
- 1795 Plan at Kalea Bay
- 1715 Plan at Kalea Bay
- 6059 Orchid Falls St Unit 11
- 6063 Orchid Falls St
- 6063 Orchid Falls St Unit 12
- 6067 Orchid Falls St Unit 13
- 6071 Orchid Falls St Unit 14
- 6105 Orchid Falls St Unit 16
- 6109 Orchid Falls St Unit 17
- 6125 Orchid Falls St Unit 21
- 6133 Orchid Falls St Unit 23
- 2916 Kildare Cove Ct
- 2621 Torch Ave
- 6065 Amaryllis Falls St
- 1334 Plan at Kalea Trails
- 6051 Camden Cove St
- 6059 Camden Cove St
- 6063 Camden Cove St
- 6063 Camden Cove St Unit none
- 6047 Camden Cove St
- 6047 Camden Cove St
- 6047 Camden Cove St
- 6067 Camden Cove St
- 2751 Bridleton Ave
- 6060 Camden Cove St
- 6071 Camden Cove St
- 6064 Camden Cove St
- 2755 Bridleton Ave
- 6068 Camden Cove St
- 6075 Camden Cove St
- 2759 Bridleton Ave
- 2657 Blue Dawn Falls Ave
- 6072 Camden Cove St
- 6072 Camden Cove St Unit na
- 6079 Camden Cove St