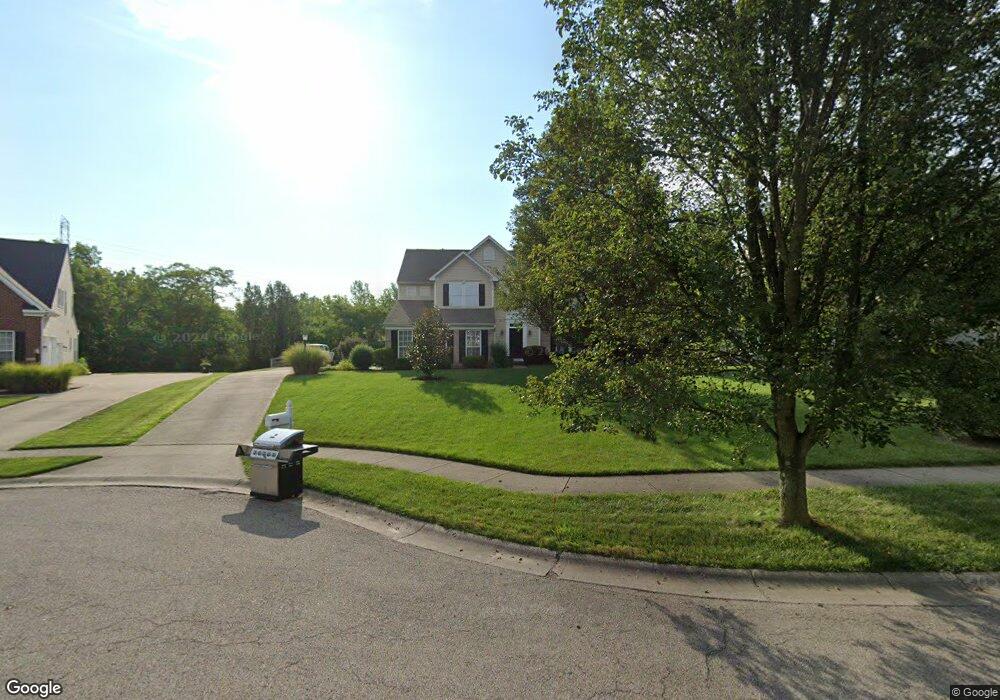
6055 Delicious Asha Ct Loveland, OH 45140
Outer Loveland NeighborhoodEstimated Value: $473,000 - $542,000
3
Beds
3
Baths
2,696
Sq Ft
$187/Sq Ft
Est. Value
About This Home
This home is located at 6055 Delicious Asha Ct, Loveland, OH 45140 and is currently estimated at $504,246, approximately $187 per square foot. 6055 Delicious Asha Ct is a home located in Clermont County with nearby schools including Milford Senior High School, Milford Christian Academy, and St. Andrew - St. Elizabeth Ann Seton School.
Ownership History
Date
Name
Owned For
Owner Type
Purchase Details
Closed on
Mar 24, 2002
Sold by
Mullins Patrick B
Bought by
King Peggy A
Current Estimated Value
Home Financials for this Owner
Home Financials are based on the most recent Mortgage that was taken out on this home.
Original Mortgage
$195,700
Outstanding Balance
$81,116
Interest Rate
6.95%
Mortgage Type
New Conventional
Estimated Equity
$423,130
Purchase Details
Closed on
Jul 17, 2000
Sold by
N V R Inc
Bought by
Mullins Patrick B and Green Lara C
Home Financials for this Owner
Home Financials are based on the most recent Mortgage that was taken out on this home.
Original Mortgage
$211,086
Interest Rate
7.38%
Mortgage Type
New Conventional
Purchase Details
Closed on
Mar 3, 2000
Sold by
Bramblewood Dev Inc
Bought by
N V R Inc
Create a Home Valuation Report for This Property
The Home Valuation Report is an in-depth analysis detailing your home's value as well as a comparison with similar homes in the area
Home Values in the Area
Average Home Value in this Area
Purchase History
| Date | Buyer | Sale Price | Title Company |
|---|---|---|---|
| King Peggy A | $206,000 | -- | |
| Mullins Patrick B | $222,196 | -- | |
| N V R Inc | $35,000 | -- |
Source: Public Records
Mortgage History
| Date | Status | Borrower | Loan Amount |
|---|---|---|---|
| Open | King Peggy A | $195,700 | |
| Previous Owner | Mullins Patrick B | $211,086 |
Source: Public Records
Tax History Compared to Growth
Tax History
| Year | Tax Paid | Tax Assessment Tax Assessment Total Assessment is a certain percentage of the fair market value that is determined by local assessors to be the total taxable value of land and additions on the property. | Land | Improvement |
|---|---|---|---|---|
| 2024 | $5,897 | $127,230 | $26,600 | $100,630 |
| 2023 | $5,957 | $127,230 | $26,600 | $100,630 |
| 2022 | $5,809 | $94,510 | $19,780 | $74,730 |
| 2021 | $5,815 | $94,510 | $19,780 | $74,730 |
| 2020 | $5,588 | $94,510 | $19,780 | $74,730 |
| 2019 | $6,098 | $98,000 | $19,670 | $78,330 |
| 2018 | $6,091 | $98,000 | $19,670 | $78,330 |
| 2017 | $5,982 | $98,000 | $19,670 | $78,330 |
| 2016 | $5,714 | $83,760 | $16,800 | $66,960 |
| 2015 | $5,486 | $83,760 | $16,800 | $66,960 |
| 2014 | $5,251 | $83,760 | $16,800 | $66,960 |
| 2013 | $4,593 | $71,050 | $17,500 | $53,550 |
Source: Public Records
Map
Nearby Homes
- 5933 Firm Stance Dr
- 1140 Weber Rd
- 2013 Weber Rd
- 1803 Wheatfield Way
- 6379 Derbyshire Ln
- 1064 Weber Rd
- 1513 Charleston Ln
- 6149 Century Farm Dr
- 6211 Spires Dr
- 6141 Brandywine Ct
- 1124 Clover Field Dr
- 6108 Donna Jay Dr
- 1113 Clover Field Dr
- 6320 Ashford Dr
- 6211 Cook Rd
- 6467 Smith Rd
- 6647 Saddleback Way
- 6661 Paxton Guinea Rd
- 1376 Barre Ln
- 6650 Saddleback Way
- 6053 Delicious Asha Ct
- 6057 Delicious Asha Ct
- 6051 Delicious Asha Ct
- 1452 E Stoker Ct
- 6048 Delicious Asha Ct
- 6052 Delicious Asha Ct
- 6050 Delicious Asha Ct
- 6049 Delicious Asha Ct
- 6046 Delicious Asha Ct
- 1450 E Stoker Ct
- 6044 Delicious Asha Ct
- 1463 E Stoker Ct
- 6047 Delicious Asha Ct
- 5945 Firm Stance Dr
- 5943 Firm Stance Dr
- 1448 E Stoker Ct
- 5947 Firm Stance Dr
- 5941 Firm Stance Dr
- 6042 Delicious Asha Ct
- 1461 E Stoker Ct