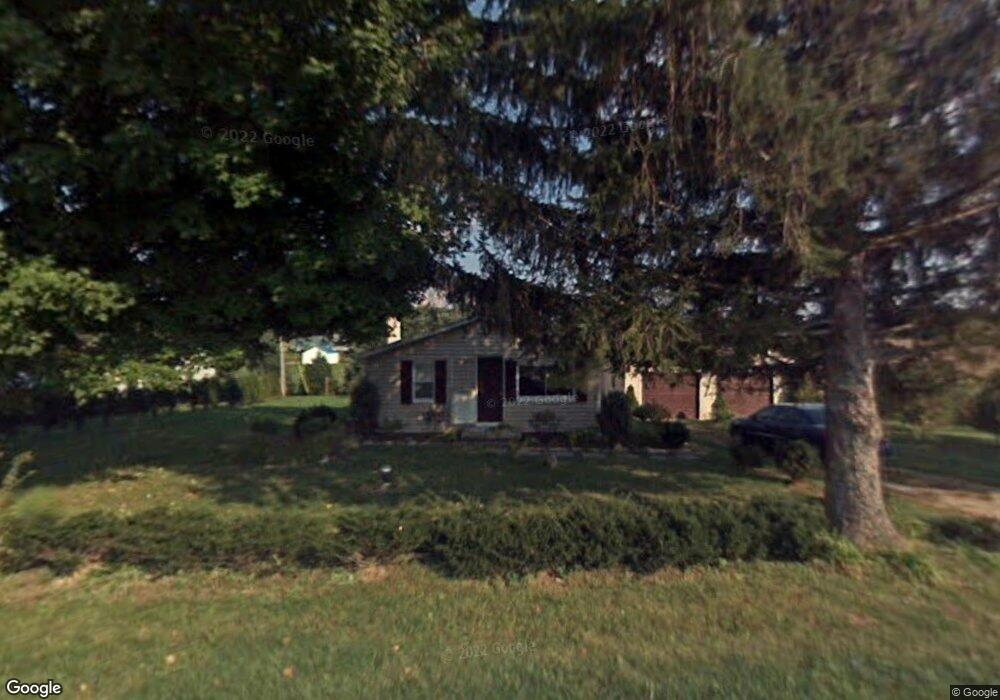
6055 Hummell Rd Carroll, OH 43112
Bloom NeighborhoodEstimated Value: $204,315 - $316,000
2
Beds
1
Bath
528
Sq Ft
$453/Sq Ft
Est. Value
About This Home
This home is located at 6055 Hummell Rd, Carroll, OH 43112 and is currently estimated at $239,329, approximately $453 per square foot. 6055 Hummell Rd is a home located in Fairfield County with nearby schools including Bloom Carroll Primary School, Bloom Carroll Intermediate School, and Bloom-Carroll Middle School.
Ownership History
Date
Name
Owned For
Owner Type
Purchase Details
Closed on
Jun 13, 2007
Sold by
Fannie Mae
Bought by
Ankrom Ernest A and Ankrom Karen R
Current Estimated Value
Home Financials for this Owner
Home Financials are based on the most recent Mortgage that was taken out on this home.
Original Mortgage
$60,325
Outstanding Balance
$37,052
Interest Rate
6.26%
Mortgage Type
Purchase Money Mortgage
Estimated Equity
$202,277
Purchase Details
Closed on
Mar 23, 2007
Sold by
Martinez Connie S and Martinez Felimon R
Bought by
Fanniemae and Federal National Mortgage Association
Purchase Details
Closed on
Sep 23, 2006
Sold by
Martinez Felimon R
Bought by
Martinez Connie S
Purchase Details
Closed on
Apr 16, 2004
Sold by
Miller Donald Michael and Miller Sandra K
Bought by
Martinez Felimon R and Martinez Connie S
Home Financials for this Owner
Home Financials are based on the most recent Mortgage that was taken out on this home.
Original Mortgage
$78,750
Interest Rate
5.48%
Mortgage Type
Purchase Money Mortgage
Purchase Details
Closed on
Jan 1, 1990
Create a Home Valuation Report for This Property
The Home Valuation Report is an in-depth analysis detailing your home's value as well as a comparison with similar homes in the area
Home Values in the Area
Average Home Value in this Area
Purchase History
| Date | Buyer | Sale Price | Title Company |
|---|---|---|---|
| Ankrom Ernest A | $63,500 | Title First Agency | |
| Fanniemae | $61,000 | Commonwealth Land Title Insu | |
| Martinez Connie S | -- | None Available | |
| Martinez Felimon R | $87,500 | -- | |
| -- | $47,000 | -- |
Source: Public Records
Mortgage History
| Date | Status | Borrower | Loan Amount |
|---|---|---|---|
| Open | Ankrom Ernest A | $60,325 | |
| Previous Owner | Martinez Felimon R | $78,750 |
Source: Public Records
Tax History Compared to Growth
Tax History
| Year | Tax Paid | Tax Assessment Tax Assessment Total Assessment is a certain percentage of the fair market value that is determined by local assessors to be the total taxable value of land and additions on the property. | Land | Improvement |
|---|---|---|---|---|
| 2024 | $3,739 | $45,380 | $12,920 | $32,460 |
| 2023 | $1,967 | $45,380 | $12,920 | $32,460 |
| 2022 | $1,981 | $45,380 | $12,920 | $32,460 |
| 2021 | $1,612 | $33,390 | $10,340 | $23,050 |
| 2020 | $1,630 | $33,390 | $10,340 | $23,050 |
| 2019 | $1,635 | $33,390 | $10,340 | $23,050 |
| 2018 | $1,213 | $24,720 | $8,730 | $15,990 |
| 2017 | $1,145 | $25,030 | $8,320 | $16,710 |
| 2016 | $1,128 | $25,030 | $8,320 | $16,710 |
| 2015 | $1,097 | $23,660 | $8,320 | $15,340 |
| 2014 | $1,054 | $23,660 | $8,320 | $15,340 |
| 2013 | $1,054 | $23,660 | $8,320 | $15,340 |
Source: Public Records
Map
Nearby Homes
- 7450 Broad St NW
- 5842 Feldon Ct NW
- 5804 Feldon Ct NW
- 4900 Pickerington Rd NW
- 6415 Winchester Rd NW
- 6556 Castlewood Dr NW
- 4400 Kauffman Rd NW
- 4180 Stone Hill Drive East NW
- 53 S Beaver St
- 7234 Pickerington Rd
- 2155 Carroll-Southern Rd NW
- 7190 Amanda Northern Rd NW
- 8981 Winchester Rd
- 4656 Meadow Grove Dr NW
- 5161 Mason Rd
- Grandin Plan at Sycamore Springs - Designer Collection
- Carrington Plan at Sycamore Springs - Designer Collection
- Wyatt Plan at Sycamore Springs - Designer Collection
- Denali Plan at Sycamore Springs - Maple Street Collection
- Magnolia Plan at Sycamore Springs - Designer Collection
- 6055 Hummel Rd
- 6725 Lockville Rd
- 6655 Lockville Rd
- 6615 Lockville Rd
- 6615 Lockville Rd NW
- 6585 Lockville Rd
- 6585 Lockville Rd NW
- 6350 Hummell Rd
- 6575 Hummell Rd
- 7120 Lockville Rd
- 6600 Hummell Rd
- 6265 Pleasantville Rd
- 6676 Hummell Rd
- 7144 Lockville Rd
- 6676 Hummel Rd
- 6702 Hummell Rd
- 6702 Hummel Rd
- 6770 Hummel Rd
- 6740 Hummell Rd
- 7158 Lockville Rd