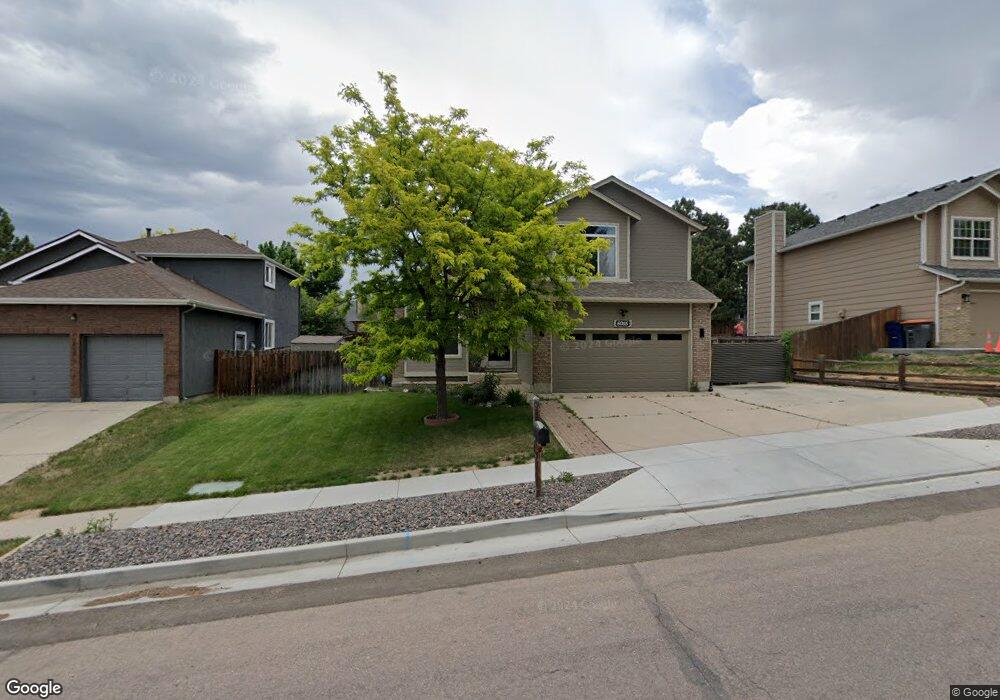
6055 Northwind Dr Colorado Springs, CO 80918
Norwood NeighborhoodEstimated Value: $466,000 - $479,000
4
Beds
4
Baths
2,479
Sq Ft
$191/Sq Ft
Est. Value
About This Home
This home is located at 6055 Northwind Dr, Colorado Springs, CO 80918 and is currently estimated at $473,706, approximately $191 per square foot. 6055 Northwind Dr is a home located in El Paso County with nearby schools including Martinez Elementary School, Jenkins Middle School, and Doherty High School.
Ownership History
Date
Name
Owned For
Owner Type
Purchase Details
Closed on
Jul 26, 2018
Sold by
Moffat John M and Moffat Amanda C
Bought by
Taylor Roberta J
Current Estimated Value
Home Financials for this Owner
Home Financials are based on the most recent Mortgage that was taken out on this home.
Original Mortgage
$296,530
Outstanding Balance
$259,576
Interest Rate
4.87%
Mortgage Type
FHA
Estimated Equity
$214,130
Purchase Details
Closed on
Jul 29, 2014
Sold by
Labelle Emmanuel D
Bought by
Moffat John M and Moffat Amanda C
Home Financials for this Owner
Home Financials are based on the most recent Mortgage that was taken out on this home.
Original Mortgage
$257,418
Interest Rate
4.2%
Mortgage Type
VA
Purchase Details
Closed on
Jun 10, 2014
Sold by
Wathke Labelle Carrie Lynn and Labelle Emmanuel D
Bought by
Labelle Emmanuel D
Home Financials for this Owner
Home Financials are based on the most recent Mortgage that was taken out on this home.
Original Mortgage
$257,418
Interest Rate
4.2%
Mortgage Type
VA
Purchase Details
Closed on
Aug 2, 2010
Sold by
Booth Bart L and Booth Allisyn E
Bought by
Wathke Labelle Carrie Lynn and Labelle Emmanuel D
Home Financials for this Owner
Home Financials are based on the most recent Mortgage that was taken out on this home.
Original Mortgage
$209,000
Interest Rate
4.69%
Mortgage Type
New Conventional
Purchase Details
Closed on
Oct 26, 2001
Sold by
Booth Bart L and Milliken Allisyn E
Bought by
Booth Bart L and Booth Allisyn E
Home Financials for this Owner
Home Financials are based on the most recent Mortgage that was taken out on this home.
Original Mortgage
$161,130
Interest Rate
6.71%
Purchase Details
Closed on
Jun 23, 2000
Sold by
Patrick Derock
Bought by
Milliken Allisyn E and Booth Bart L
Home Financials for this Owner
Home Financials are based on the most recent Mortgage that was taken out on this home.
Original Mortgage
$158,692
Interest Rate
8.5%
Mortgage Type
FHA
Purchase Details
Closed on
Jan 26, 1995
Sold by
Hallmark Building Company Ltd I
Bought by
Derock Patrick and Derock Marjorie A M D
Home Financials for this Owner
Home Financials are based on the most recent Mortgage that was taken out on this home.
Original Mortgage
$135,078
Interest Rate
9%
Mortgage Type
VA
Purchase Details
Closed on
May 20, 1994
Sold by
Norwood Development Corp
Bought by
Hallmark Building Company Ltd I
Purchase Details
Closed on
Dec 1, 1987
Bought by
Moffat John M
Create a Home Valuation Report for This Property
The Home Valuation Report is an in-depth analysis detailing your home's value as well as a comparison with similar homes in the area
Home Values in the Area
Average Home Value in this Area
Purchase History
| Date | Buyer | Sale Price | Title Company |
|---|---|---|---|
| Taylor Roberta J | $302,000 | North American Title | |
| Moffat John M | $252,000 | None Available | |
| Labelle Emmanuel D | -- | None Available | |
| Wathke Labelle Carrie Lynn | $220,000 | Enterprise Title Lllp | |
| Booth Bart L | -- | Stewart Title | |
| Milliken Allisyn E | $160,000 | First American | |
| Derock Patrick | -- | Unified Title Co Inc | |
| Hallmark Building Company Ltd I | $22,000 | -- | |
| Moffat John M | -- | -- |
Source: Public Records
Mortgage History
| Date | Status | Borrower | Loan Amount |
|---|---|---|---|
| Open | Taylor Roberta J | $296,530 | |
| Previous Owner | Moffat John M | $257,418 | |
| Previous Owner | Wathke Labelle Carrie Lynn | $209,000 | |
| Previous Owner | Booth Bart L | $161,130 | |
| Previous Owner | Milliken Allisyn E | $158,692 | |
| Previous Owner | Derock Patrick | $135,078 |
Source: Public Records
Tax History Compared to Growth
Tax History
| Year | Tax Paid | Tax Assessment Tax Assessment Total Assessment is a certain percentage of the fair market value that is determined by local assessors to be the total taxable value of land and additions on the property. | Land | Improvement |
|---|---|---|---|---|
| 2025 | $1,647 | $32,090 | -- | -- |
| 2024 | $1,532 | $32,050 | $5,700 | $26,350 |
| 2022 | $1,418 | $23,670 | $5,060 | $18,610 |
| 2021 | $1,533 | $24,360 | $5,210 | $19,150 |
| 2020 | $1,596 | $22,220 | $4,530 | $17,690 |
| 2019 | $1,587 | $22,220 | $4,530 | $17,690 |
| 2018 | $1,491 | $19,290 | $3,810 | $15,480 |
| 2017 | $1,416 | $19,290 | $3,810 | $15,480 |
| 2016 | $1,040 | $16,800 | $3,940 | $12,860 |
| 2015 | $931 | $15,100 | $3,940 | $11,160 |
| 2014 | $888 | $13,850 | $3,890 | $9,960 |
Source: Public Records
Map
Nearby Homes
- 3840 Summer Breeze Dr
- 3550 Summer Breeze Dr
- 6125 Northwind Dr
- 3613 Summer Breeze Dr
- 3716 Adirondack Dr
- 3887 Point of the Rocks Dr
- 6030 Barnacle Ct
- 6175 Montarbor Dr
- 3437 Trenary Ln Unit 3437
- 6152 Del Paz Dr
- 4265 Dolphin Cir
- 3370 Bell Mountain Dr
- 6028 Copper Mountain Dr
- 3520 Lost Hills Ct
- 5750 Red Onion Way
- 6675 Lange Cir
- 3928 Diamond Ridge View
- 5904 Mapleton Dr
- 6450 Fall River Dr
- 5926 Del Paz Dr
- 6045 Northwind Dr
- 6065 Northwind Dr
- 3715 Moose Run Dr
- 3725 Moose Run Dr
- 3705 Moose Run Dr
- 6035 Northwind Dr
- 5930 Topview Ct
- 3735 Moose Run Dr
- 5995 Bestview Way
- 6025 Northwind Dr
- 6075 Northwind Dr
- 3745 Moose Run Dr
- 5920 Topview Ct
- 5985 Bestview Way
- 6030 Northwind Dr
- 6010 Rangeland Place
- 3720 Moose Run Dr
- 3730 Moose Run Dr
- 5996 Bestview Way
- 6045 Bestview Way