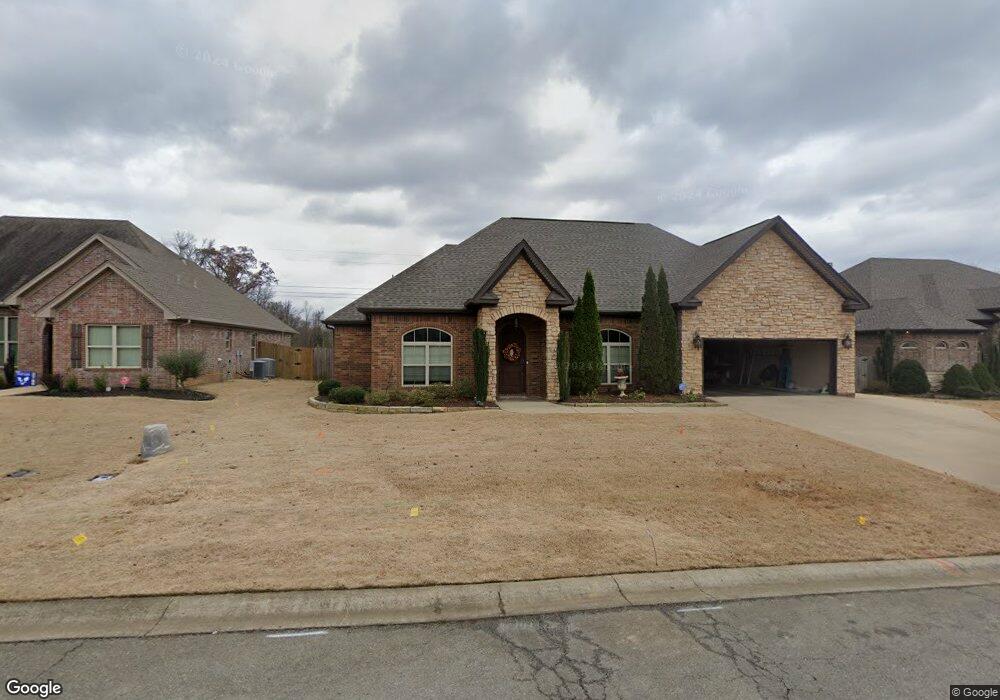
6055 Pierce Manse Loop Benton, AR 72019
Estimated Value: $365,000 - $389,000
Studio
3
Baths
2,389
Sq Ft
$158/Sq Ft
Est. Value
About This Home
This home is located at 6055 Pierce Manse Loop, Benton, AR 72019 and is currently estimated at $377,683, approximately $158 per square foot. 6055 Pierce Manse Loop is a home located in Saline County with nearby schools including Springhill Elementary School.
Ownership History
Date
Name
Owned For
Owner Type
Purchase Details
Closed on
Mar 29, 2019
Sold by
Hill Charles
Bought by
Hill Katherine Skillen
Current Estimated Value
Home Financials for this Owner
Home Financials are based on the most recent Mortgage that was taken out on this home.
Original Mortgage
$205,000
Outstanding Balance
$179,863
Interest Rate
4.3%
Mortgage Type
New Conventional
Estimated Equity
$197,820
Purchase Details
Closed on
Jun 17, 2009
Sold by
Rqm Llc
Bought by
Hill Charles and Hill Katherine
Home Financials for this Owner
Home Financials are based on the most recent Mortgage that was taken out on this home.
Original Mortgage
$204,000
Interest Rate
4.84%
Mortgage Type
New Conventional
Purchase Details
Closed on
Jan 7, 2009
Sold by
Outback Development Llc
Bought by
Rqm Llc
Home Financials for this Owner
Home Financials are based on the most recent Mortgage that was taken out on this home.
Original Mortgage
$186,400
Interest Rate
5.42%
Mortgage Type
Construction
Create a Home Valuation Report for This Property
The Home Valuation Report is an in-depth analysis detailing your home's value as well as a comparison with similar homes in the area
Home Values in the Area
Average Home Value in this Area
Purchase History
| Date | Buyer | Sale Price | Title Company |
|---|---|---|---|
| Hill Katherine Skillen | -- | Lenders Title Company | |
| Hill Charles | $224,000 | -- | |
| Rqm Llc | $39,000 | -- |
Source: Public Records
Mortgage History
| Date | Status | Borrower | Loan Amount |
|---|---|---|---|
| Open | Hill Katherine Skillen | $205,000 | |
| Closed | Hill Charles | $204,000 | |
| Previous Owner | Rqm Llc | $186,400 |
Source: Public Records
Tax History
| Year | Tax Paid | Tax Assessment Tax Assessment Total Assessment is a certain percentage of the fair market value that is determined by local assessors to be the total taxable value of land and additions on the property. | Land | Improvement |
|---|---|---|---|---|
| 2025 | $3,039 | $61,947 | $11,400 | $50,547 |
| 2024 | $2,888 | $61,947 | $11,400 | $50,547 |
| 2023 | $2,839 | $61,947 | $11,400 | $50,547 |
| 2022 | $2,757 | $61,947 | $11,400 | $50,547 |
| 2021 | $2,635 | $48,860 | $8,800 | $40,060 |
| 2020 | $2,635 | $48,860 | $8,800 | $40,060 |
| 2019 | $2,533 | $46,980 | $8,800 | $38,180 |
| 2018 | $2,553 | $46,980 | $8,800 | $38,180 |
| 2017 | $2,553 | $46,980 | $8,800 | $38,180 |
| 2016 | $2,561 | $49,820 | $8,400 | $41,420 |
| 2015 | $2,561 | $49,820 | $8,400 | $41,420 |
| 2014 | $2,631 | $49,820 | $8,400 | $41,420 |
Source: Public Records
Map
Nearby Homes
- 9040 Naples Cove
- 9017 Naples Cove
- 8036 N Shoreline Blvd
- 8028 N Shoreline Blvd
- 8010 Worth Ave
- 7926 S Shoreline Blvd
- 7901 S Shoreline Blvd
- 7800 S Shoreline Blvd
- 7730 S Shoreline Blvd
- 2406 Aberdeen Dr
- 2405 Sam Tillery Dr
- 2413 Sam Tillery Dr
- 2502 Daisy Cove
- 7717 S Shoreline Blvd
- 1078 Sungate Dr
- 7611 Worth Ave E
- 5603 Lexington Ave
- 2705 Finley Loop
- 7702 S Shoreline Blvd
- 7449 Northwood Dr
- 6033 Pierce Manse Loop
- 6077 Pierce Manse Loop
- 6056 Pierce Manse Loop
- 6034 Pierce Manse Loop
- 6011 Pierce Manse Loop
- 6089 Pierce Manse Loop
- 6001 Pierce Manse Loop
- 2011 Monticello Dr
- 6097 Pierce Manse Loop
- 6003 Peacefield Cove
- 1090 Wheatland Cove
- 9045 Naples Cove
- 9049 Naples Cove
- 0 Monticello Dr Unit 20027266
- 6100 Pierce Manse Loop
- 2010 Monticello Dr
- 9041 Naples Cove
- 2021 Monticello Dr
- 6101 Pierce Manse Loop
- 6005 Peacefield Cove
Your Personal Tour Guide
Ask me questions while you tour the home.