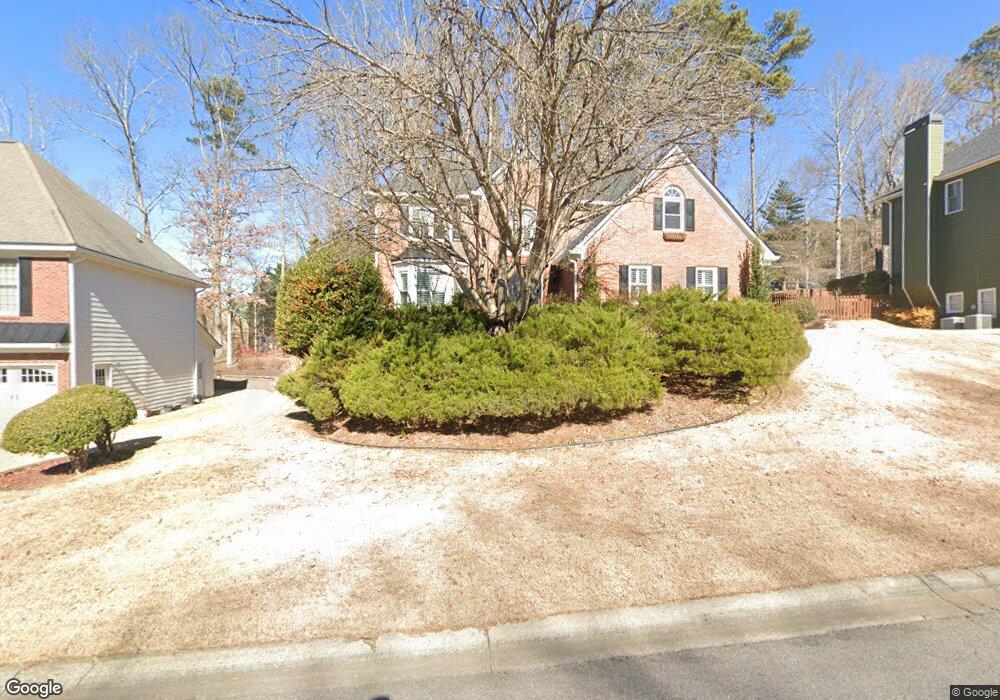
6056 Braidwood Close NW Unit 5 Acworth, GA 30101
West Cobb NeighborhoodEstimated Value: $524,000 - $542,000
4
Beds
3
Baths
2,698
Sq Ft
$197/Sq Ft
Est. Value
About This Home
This home is located at 6056 Braidwood Close NW Unit 5, Acworth, GA 30101 and is currently estimated at $531,225, approximately $196 per square foot. 6056 Braidwood Close NW Unit 5 is a home located in Cobb County with nearby schools including Vaughan Elementary School, Lost Mountain Middle School, and Harrison High School.
Ownership History
Date
Name
Owned For
Owner Type
Purchase Details
Closed on
Nov 16, 2000
Sold by
Bennett Danny L
Bought by
Myszkowski Brian K and Myszkowski Janet L
Current Estimated Value
Home Financials for this Owner
Home Financials are based on the most recent Mortgage that was taken out on this home.
Original Mortgage
$201,600
Outstanding Balance
$72,943
Interest Rate
7.81%
Mortgage Type
New Conventional
Estimated Equity
$458,282
Purchase Details
Closed on
Jul 24, 1998
Sold by
Spangler Weldon W and Spangler Amy
Bought by
Bennett Danny L
Home Financials for this Owner
Home Financials are based on the most recent Mortgage that was taken out on this home.
Original Mortgage
$189,050
Interest Rate
6.96%
Mortgage Type
New Conventional
Purchase Details
Closed on
Jul 26, 1995
Sold by
Southern Homes Residence
Bought by
Spangler Weldon W
Create a Home Valuation Report for This Property
The Home Valuation Report is an in-depth analysis detailing your home's value as well as a comparison with similar homes in the area
Home Values in the Area
Average Home Value in this Area
Purchase History
| Date | Buyer | Sale Price | Title Company |
|---|---|---|---|
| Myszkowski Brian K | $224,000 | -- | |
| Bennett Danny L | $199,000 | -- | |
| Spangler Weldon W | $180,900 | -- |
Source: Public Records
Mortgage History
| Date | Status | Borrower | Loan Amount |
|---|---|---|---|
| Open | Myszkowski Brian K | $201,600 | |
| Previous Owner | Bennett Danny L | $189,050 | |
| Closed | Spangler Weldon W | $0 |
Source: Public Records
Tax History Compared to Growth
Tax History
| Year | Tax Paid | Tax Assessment Tax Assessment Total Assessment is a certain percentage of the fair market value that is determined by local assessors to be the total taxable value of land and additions on the property. | Land | Improvement |
|---|---|---|---|---|
| 2025 | $4,405 | $187,944 | $46,000 | $141,944 |
| 2024 | $4,408 | $187,944 | $46,000 | $141,944 |
| 2023 | $3,888 | $188,980 | $34,000 | $154,980 |
| 2022 | $4,006 | $167,924 | $24,000 | $143,924 |
| 2021 | $3,406 | $140,516 | $24,000 | $116,516 |
| 2020 | $2,978 | $120,972 | $24,000 | $96,972 |
| 2019 | $2,978 | $120,972 | $24,000 | $96,972 |
| 2018 | $2,885 | $116,716 | $24,000 | $92,716 |
| 2017 | $2,792 | $116,716 | $24,000 | $92,716 |
| 2016 | $2,333 | $95,700 | $24,000 | $71,700 |
| 2015 | $2,385 | $95,700 | $24,000 | $71,700 |
| 2014 | $2,402 | $95,700 | $0 | $0 |
Source: Public Records
Map
Nearby Homes
- 6049 Braidwood Close NW Unit 5
- 582 Braidwood Dr NW
- 5900 Pavillion Dr
- 6100 Braidwood Ct NW
- 691 Braidwood Terrace NW
- 409 Santa Ana Ct
- 6211 Woodlore Dr NW
- 870 Fairwood Pointe NW
- 6128 Braidwood Ln NW
- 5725 Fairwood Dr NW
- 6246 Braidwood Way NW
- 5585 Lavender Farms Rd
- 403 Wild Iris Ln Unit 6
- 718 1st Cotton Dr
- 5882 Grandview Ct NW
- 956 Fairlong Dr NW
- 6049 Wyndham Woods Dr
- 6058 Braidwood Close NW
- 6054 Braidwood Close NW Unit 4
- 0 Braidwood Close NW
- 6000 Antioch Ct Unit 3
- 6060 Braidwood Close NW Unit 5
- 6051 Braidwood Close NW
- 6052 Braidwood Close NW
- 6053 Braidwood Close NW
- 5990 Antioch Ct
- 602 Chestatee Creek Dr NW
- 458 Braidwood Walk NW
- 6047 Braidwood Close NW
- 0 Braidwood Walk NW Unit 8248168
- 0 Braidwood Walk NW Unit 8804581
- 0 Braidwood Walk NW Unit 8930801
- 0 Braidwood Walk NW Unit 2955557
- 0 Braidwood Walk NW Unit 3252298
- 0 Braidwood Walk NW Unit 7014646
- 6050 Braidwood Close NW
- 608 Chestatee Creek Dr NW