Estimated Value: $389,000 - $420,000
4
Beds
2
Baths
1,850
Sq Ft
$218/Sq Ft
Est. Value
About This Home
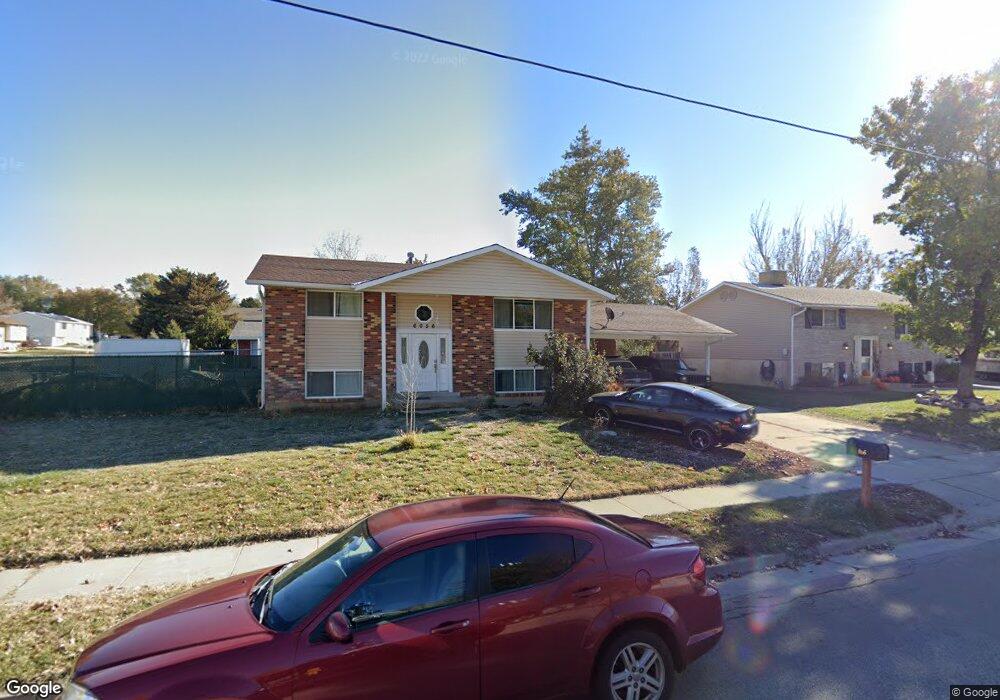
This home is located at 6056 S 2700 W, Roy, UT 84067 and is currently estimated at $402,883, approximately $217 per square foot. 6056 S 2700 W is a home located in Weber County with nearby schools including Municipal School, Roy Junior High School, and Roy High School.
Ownership History
Date
Name
Owned For
Owner Type
Purchase Details
Closed on
Nov 13, 2019
Sold by
Mathias Benjamin and Mathias Naomi
Bought by
Bautista Isabel and Martinez Robert
Current Estimated Value
Home Financials for this Owner
Home Financials are based on the most recent Mortgage that was taken out on this home.
Original Mortgage
$212,500
Outstanding Balance
$186,945
Interest Rate
3.6%
Mortgage Type
New Conventional
Estimated Equity
$215,938
Purchase Details
Closed on
Apr 7, 2016
Bought by
Mathias Benjamin
Home Financials for this Owner
Home Financials are based on the most recent Mortgage that was taken out on this home.
Original Mortgage
$180,355
Interest Rate
3.59%
Purchase Details
Closed on
Nov 14, 2012
Sold by
Isaacs Jannifer and Isaacs David
Bought by
Klinger Nicholas
Purchase Details
Closed on
Jun 23, 2003
Sold by
Davies Tyler J and Davies Jennifer
Bought by
Davies Tyler J and Davies Jennifer
Home Financials for this Owner
Home Financials are based on the most recent Mortgage that was taken out on this home.
Original Mortgage
$90,400
Interest Rate
5.26%
Mortgage Type
Purchase Money Mortgage
Purchase Details
Closed on
May 12, 1998
Sold by
Dearman Johnny D and Dearman Charlotte F
Bought by
Dearman Johnny D and Dearman Charlotte F
Home Financials for this Owner
Home Financials are based on the most recent Mortgage that was taken out on this home.
Original Mortgage
$79,500
Interest Rate
9.62%
Purchase Details
Closed on
Apr 20, 1998
Sold by
Hancock Jack E
Bought by
Davies Tyler J and Davies Jennifer
Home Financials for this Owner
Home Financials are based on the most recent Mortgage that was taken out on this home.
Original Mortgage
$79,500
Interest Rate
9.62%
Create a Home Valuation Report for This Property
The Home Valuation Report is an in-depth analysis detailing your home's value as well as a comparison with similar homes in the area
Home Values in the Area
Average Home Value in this Area
Purchase History
| Date | Buyer | Sale Price | Title Company |
|---|---|---|---|
| Bautista Isabel | -- | Us Title Insurance Agency | |
| Mathias Benjamin | -- | -- | |
| Klinger Nicholas | -- | Mountain View Title | |
| Davies Tyler J | -- | Mountain View Title | |
| Dearman Johnny D | -- | Security Title | |
| Davies Tyler J | -- | First American Title |
Source: Public Records
Mortgage History
| Date | Status | Borrower | Loan Amount |
|---|---|---|---|
| Open | Bautista Isabel | $212,500 | |
| Previous Owner | Mathias Benjamin | $180,355 | |
| Previous Owner | Mathias Benjamin | -- | |
| Previous Owner | Davies Tyler J | $90,400 | |
| Previous Owner | Dearman Johnny D | $79,500 | |
| Previous Owner | Davies Tyler J | $98,517 | |
| Closed | Davies Tyler J | $16,950 |
Source: Public Records
Tax History
| Year | Tax Paid | Tax Assessment Tax Assessment Total Assessment is a certain percentage of the fair market value that is determined by local assessors to be the total taxable value of land and additions on the property. | Land | Improvement |
|---|---|---|---|---|
| 2025 | $2,454 | $386,087 | $120,026 | $266,061 |
| 2024 | $2,262 | $195,799 | $66,014 | $129,785 |
| 2023 | $2,116 | $182,600 | $65,864 | $116,736 |
| 2022 | $2,225 | $199,100 | $57,758 | $141,342 |
| 2021 | $1,810 | $265,000 | $75,002 | $189,998 |
| 2020 | $1,749 | $236,000 | $75,002 | $160,998 |
| 2019 | $1,652 | $209,000 | $44,976 | $164,024 |
| 2018 | $1,515 | $179,000 | $40,002 | $138,998 |
| 2017 | $1,470 | $163,000 | $37,050 | $125,950 |
| 2016 | $1,361 | $80,536 | $16,499 | $64,037 |
| 2015 | $1,162 | $69,100 | $16,499 | $52,601 |
| 2014 | $1,171 | $69,100 | $16,499 | $52,601 |
Source: Public Records
Map
Nearby Homes
Your Personal Tour Guide
Ask me questions while you tour the home.