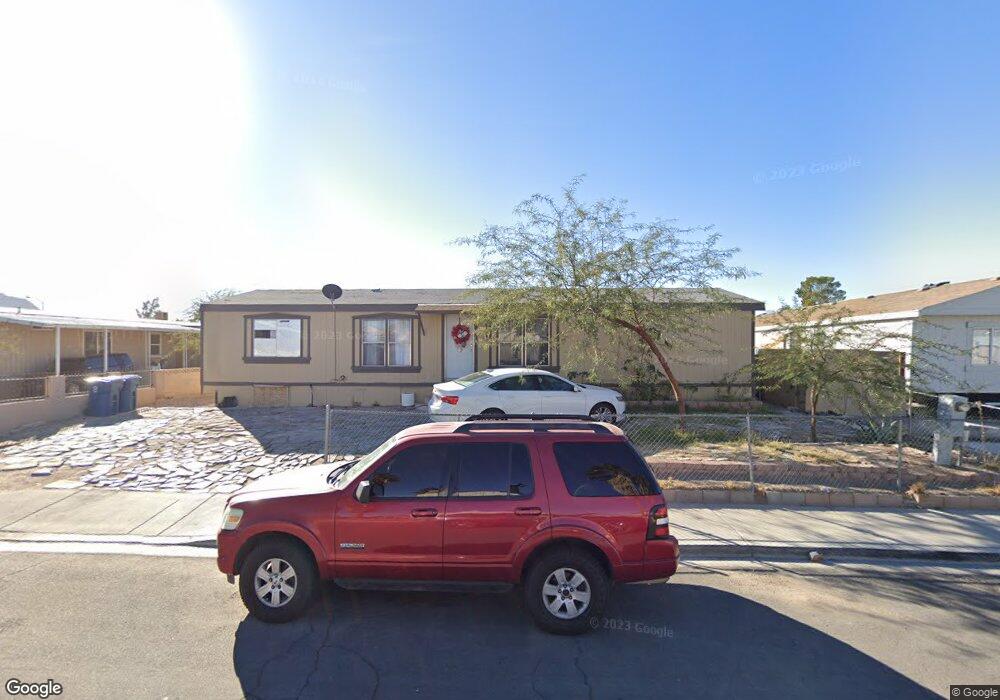
6057 Castlemont Ave Las Vegas, NV 89156
Estimated Value: $184,023 - $305,000
3
Beds
2
Baths
1,344
Sq Ft
$192/Sq Ft
Est. Value
About This Home
This home is located at 6057 Castlemont Ave, Las Vegas, NV 89156 and is currently estimated at $258,006, approximately $191 per square foot. 6057 Castlemont Ave is a home located in Clark County with nearby schools including Helen Herr Elementary School, Dr. William H. Bailey Middle School, and Sunrise Mountain High School.
Ownership History
Date
Name
Owned For
Owner Type
Purchase Details
Closed on
Jun 27, 2025
Sold by
Davila Tellez Noel and Tellez Davila Noe
Bought by
Davila Family Trust and Davila
Current Estimated Value
Purchase Details
Closed on
May 28, 2024
Sold by
Castro Ricardo
Bought by
Tellez Neal Davila
Purchase Details
Closed on
Jan 11, 2005
Sold by
Chee Jerome and Chee Betty A
Bought by
Castro Ricardo
Home Financials for this Owner
Home Financials are based on the most recent Mortgage that was taken out on this home.
Original Mortgage
$113,124
Interest Rate
5.67%
Mortgage Type
FHA
Purchase Details
Closed on
Aug 10, 1998
Sold by
Smith David and Smith Becky
Bought by
Chee Jerome and Chee Betty A
Home Financials for this Owner
Home Financials are based on the most recent Mortgage that was taken out on this home.
Original Mortgage
$74,853
Interest Rate
6.95%
Mortgage Type
FHA
Create a Home Valuation Report for This Property
The Home Valuation Report is an in-depth analysis detailing your home's value as well as a comparison with similar homes in the area
Home Values in the Area
Average Home Value in this Area
Purchase History
| Date | Buyer | Sale Price | Title Company |
|---|---|---|---|
| Davila Family Trust | -- | None Listed On Document | |
| Tellez Neal Davila | $134,460 | None Listed On Document | |
| Castro Ricardo | $114,900 | Lawyers Title Of Nevada | |
| Chee Jerome | $77,000 | Lawyers Title |
Source: Public Records
Mortgage History
| Date | Status | Borrower | Loan Amount |
|---|---|---|---|
| Previous Owner | Castro Ricardo | $113,124 | |
| Previous Owner | Chee Jerome | $74,853 |
Source: Public Records
Tax History Compared to Growth
Tax History
| Year | Tax Paid | Tax Assessment Tax Assessment Total Assessment is a certain percentage of the fair market value that is determined by local assessors to be the total taxable value of land and additions on the property. | Land | Improvement |
|---|---|---|---|---|
| 2025 | $722 | $46,718 | $23,100 | $23,618 |
| 2024 | $459 | $46,718 | $23,100 | $23,618 |
| 2023 | $459 | $41,693 | $19,250 | $22,443 |
| 2022 | $425 | $36,036 | $15,400 | $20,636 |
| 2021 | $394 | $33,397 | $13,650 | $19,747 |
| 2020 | $363 | $31,944 | $12,250 | $19,694 |
| 2019 | $340 | $29,436 | $9,800 | $19,636 |
| 2018 | $325 | $25,718 | $6,650 | $19,068 |
| 2017 | $712 | $24,267 | $6,650 | $17,617 |
| 2016 | $305 | $25,905 | $6,300 | $19,605 |
| 2015 | $304 | $25,241 | $5,250 | $19,991 |
| 2014 | $294 | $10,276 | $5,250 | $5,026 |
Source: Public Records
Map
Nearby Homes
- 5988 Castlemont Ave
- 5987 Stone Hollow Ave
- 6012 Riflecrest Ave
- 6132 Stone Hollow Ave
- 5994 Rocky Mountain Ave
- 5988 Turtle River Ave
- 2724 Echo Springs St
- 2776 Jupiter Creek St
- 2775 Herron Hills St
- 2764 Echo Springs St
- 2357 Flaming Gorge St
- 6266 Bluehurst Ave
- 6071 Big Bend Ave
- 5822 E Carey Ave
- 2273 Toiyabe St
- 2257 Toiyabe St
- 6061 Judson Ave
- 2242 Toiyabe St
- 6288 Branded Brook Ave
- 6374 Horizon Ridge Ct
- 6047 Castlemont Ave
- 6046 Casa Loma Ave
- 6037 Castlemont Ave
- 6076 Casa Loma Ave
- 6048 Castlemont Ave
- 6036 Casa Loma Ave
- 6085 Castlemont Ave
- 6038 Castlemont Ave
- 6027 Castlemont Ave
- 6026 Casa Loma Ave
- 6055 Casa Loma Ave
- 6095 Castlemont Ave
- 6065 Bluehill Ave
- 6045 Casa Loma Ave
- 6017 Castlemont Ave
- 6075 Casa Loma Ave
- 6016 Casa Loma Ave
- 6075 Bluehill Ave
- 6035 Casa Loma Ave
- 6096 Castlemont Ave